
Translational Scientist
3D spatial biology for translational research
Connect tissue biology to development decisions
Preserve intact tissue architecture and generate quantitative 3D readouts for mechanism of action, treatment response, biodistribution, safety, and biomarker development. Alpenglow helps translational teams examine cells, structures, and spatial relationships across the full tissue volume rather than selected 2D sections.
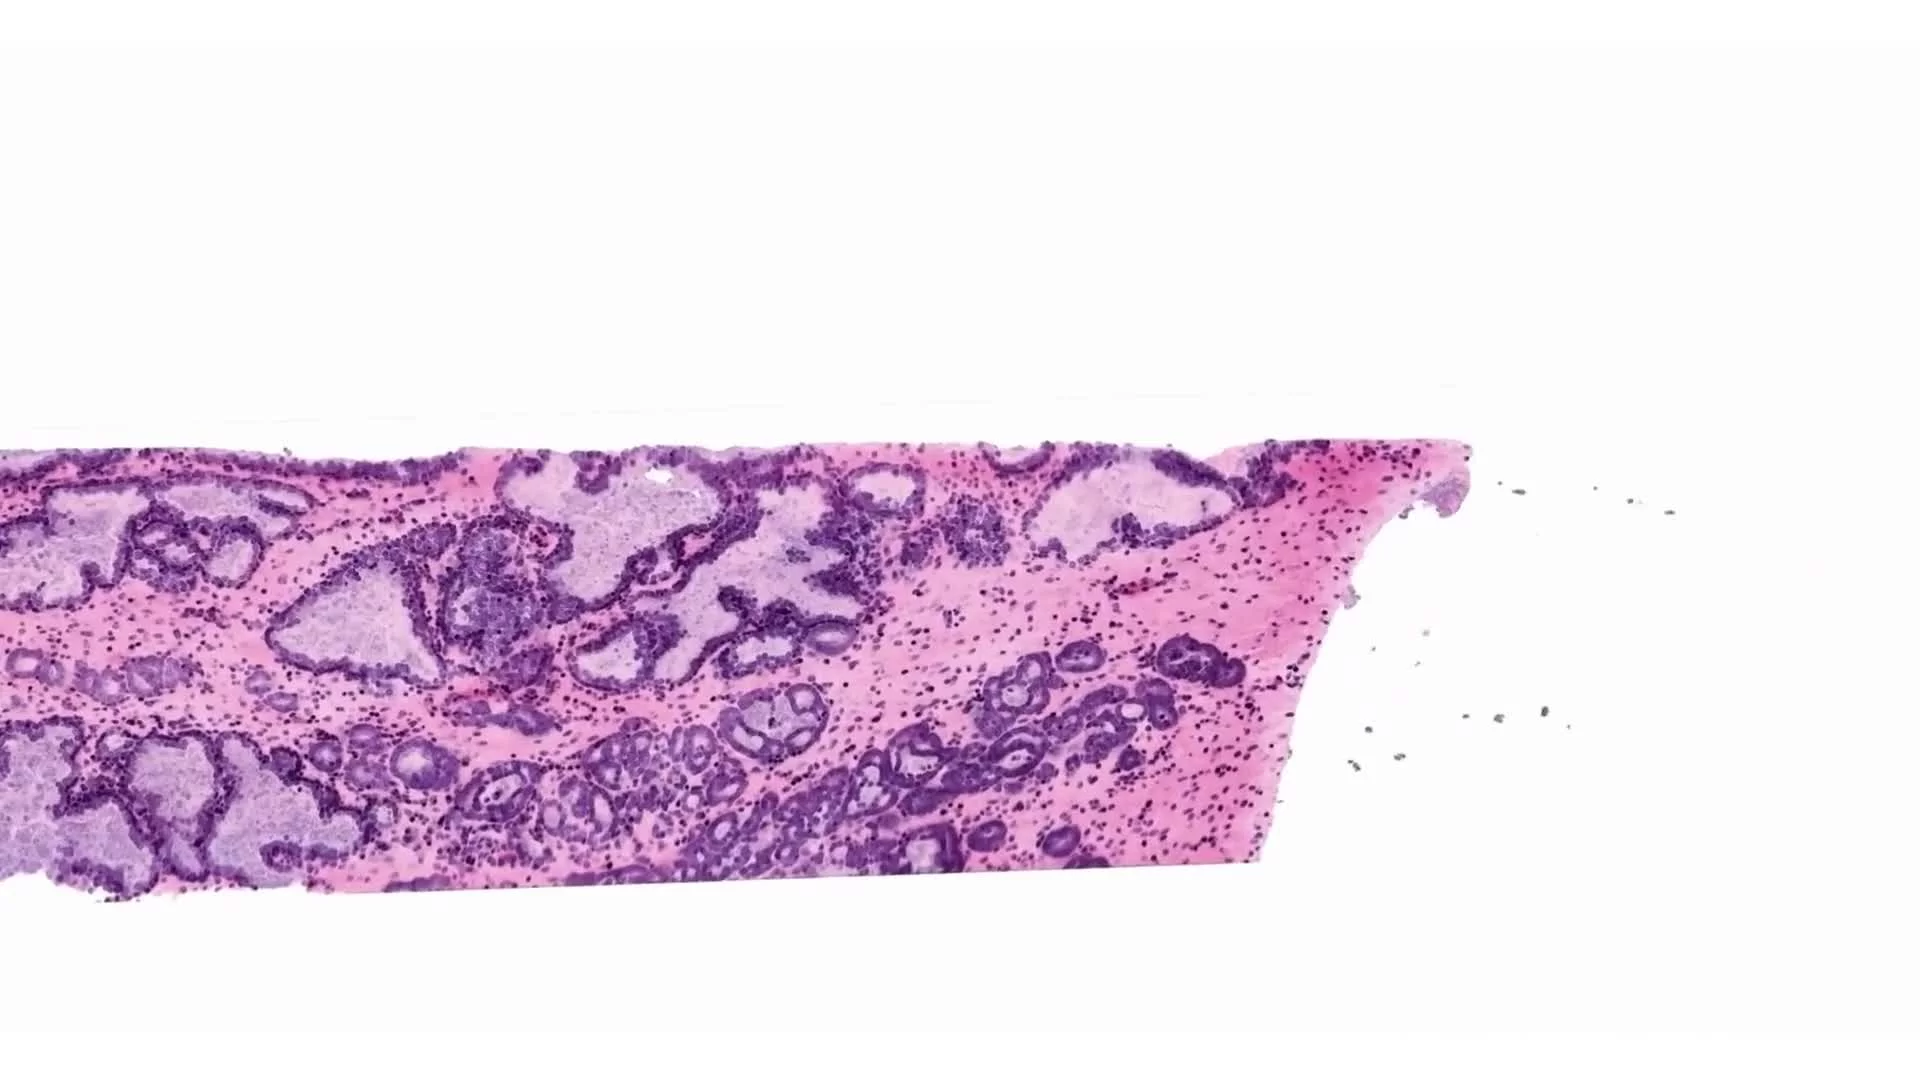
3D segmentation of prostate glands using synthetic CK8 immunofluorescence derived from fluorescent H&E analogues. By combining image-translation models with traditional computer-vision methods, researchers achieved whole-biopsy 3D gland segmentation without manual labeling.
This study demonstrates annotation-free 3D segmentation of prostate glands using fluorescence-based microscopy and AI. A prostate specimen stained with a fluorescent analogue of H&E was converted into a synthetic CK8 immunofluorescence dataset via an image-sequence translation model trained on paired H&E analogue and real CK8 datasets. Traditional computer-vision algorithms were then applied to the synthetic CK8 images for segmentation of gland epithelium, lumen, and stromal regions. The synthetic CK8 image blocks were mosaicked to reconstruct a 3D CK8 dataset of the entire biopsy, enabling accurate gland segmentation. Gland lumen spaces were further segmented by filling regions enclosed by epithelia, with refinements from the cytoplasm (eosin) channel.
3D images acquired with the Aurora™ 3Di Hybrid Open Top Light Sheet (HOTLS) microscope.
With integration of 3Dm data management and 3Dai AI-powered segmentation, researchers can perform reproducible, high-content quantification. This 3D approach eliminates slice bias and ensures accurate analysis at scale.
From vasculature to single cells, 3D light-sheet imaging reveals the intricate architecture of a whole mouse brain in unparalleled detail.
This dataset showcases 3D light-sheet imaging of a whole mouse brain, captured with the Aurora™ 3Di Hybrid Open Top Light Sheet (HOTLS) microscope. From organ-level vasculature down to single-cell resolution, the imaging reveals the full intricacy of brain architecture across every layer.
The dataset highlights how volumetric imaging preserves intact morphology, making it possible to study neuronal networks, vascular pathways, and cellular organization without the distortions of traditional 2D histology.
Complete visualization of neuronal and vascular networks across the brain
Cellular context preserved in full volumetric detail
Accurate mapping of tissue complexity that 2D slices cannot replicate
This dataset connects directly to the Nature Methods paper presenting our light-sheet microscope: Read the paper.
By combining 3Dm data management with 3Dai AI-powered segmentation, researchers can extend these visuals into actionable analyses, from neuronal density measurements to vascular branching and spatial profiling.
Applications include neuroscience research, brain mapping, and studies of neurodegenerative diseases, where understanding tissue complexity in situ is critical.
Translational readouts
What translational scientists can measure in 3D
Examine where a therapy reaches, how intact tissue responds, and whether spatial changes support the intended biological effect. Whole-tissue imaging and AI-powered analysis convert complex architecture into quantitative evidence across the full sample.
Mechanism of action and pharmacodynamics
Assess target-associated changes, cellular responses, tissue structures, and spatial relationships across intact samples rather than selected sections.
Biodistribution and delivery
Map where a therapy, vector, or labeled payload is detected and examine how its distribution varies across anatomical regions and tissue compartments.
Efficacy and tissue response
Quantify treatment-associated changes in cell density, morphology, infiltration, volumes, branching patterns, and tissue organization across experimental conditions.
Safety and tissue biomarkers
Examine on-target and off-target tissue effects while generating quantitative spatial readouts that can support biomarker discovery and response assessment.
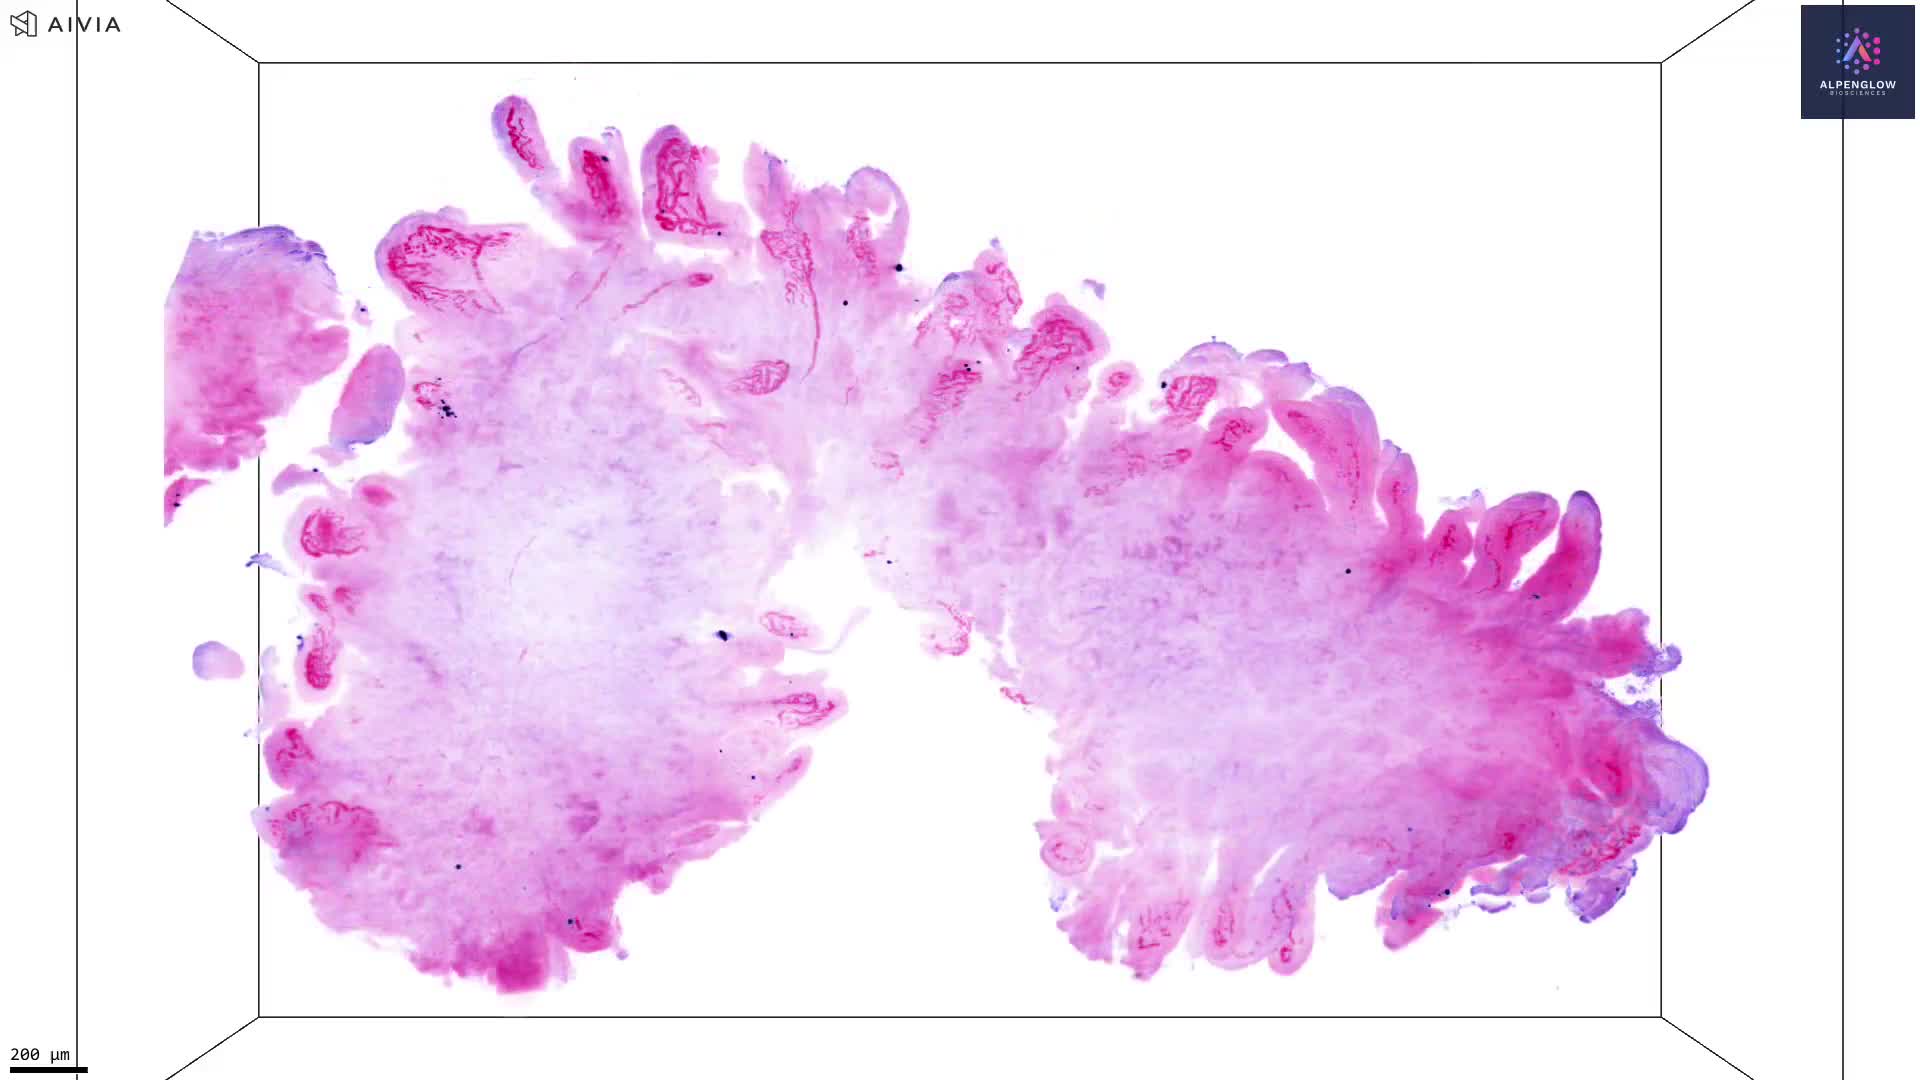
Explore human duodenum tissue in 3D using eosin and TO-PRO-3 in an H&E-like visualization. Volumetric imaging preserves villous morphology and spatial organization across depth and can support quantitative analysis of villus dimensions, density, spacing, and regional variation.
This video presents a volumetric visualization of human duodenum tissue stained with eosin and the nuclear marker TO-PRO-3, then pseudocolored to create an H&E-like appearance.
3D tissue imaging reveals intestinal villi as continuous structures across the imaged volume, preserving information about their morphology, orientation, spacing, density, and regional organization. Viewing villi across depth also reduces the influence of sectioning angle and sampling location that can affect measurements from individual 2D sections.
With appropriate segmentation, the dataset can support quantitative analysis of villus number, height, width, volume, elongation, spacing, density, and variation across tissue regions.
These measurements are relevant to gastrointestinal research, including studies of celiac disease, where villous architecture may become shortened, flattened, fused, or otherwise disrupted. Quantifying these changes across a tissue volume could help characterize the distribution and heterogeneity of structural alterations.
The tissue was imaged on the Aurora 3D™ platform using the 3Di™ Hybrid Open-Top Light-Sheet (HOTLS) microscope.
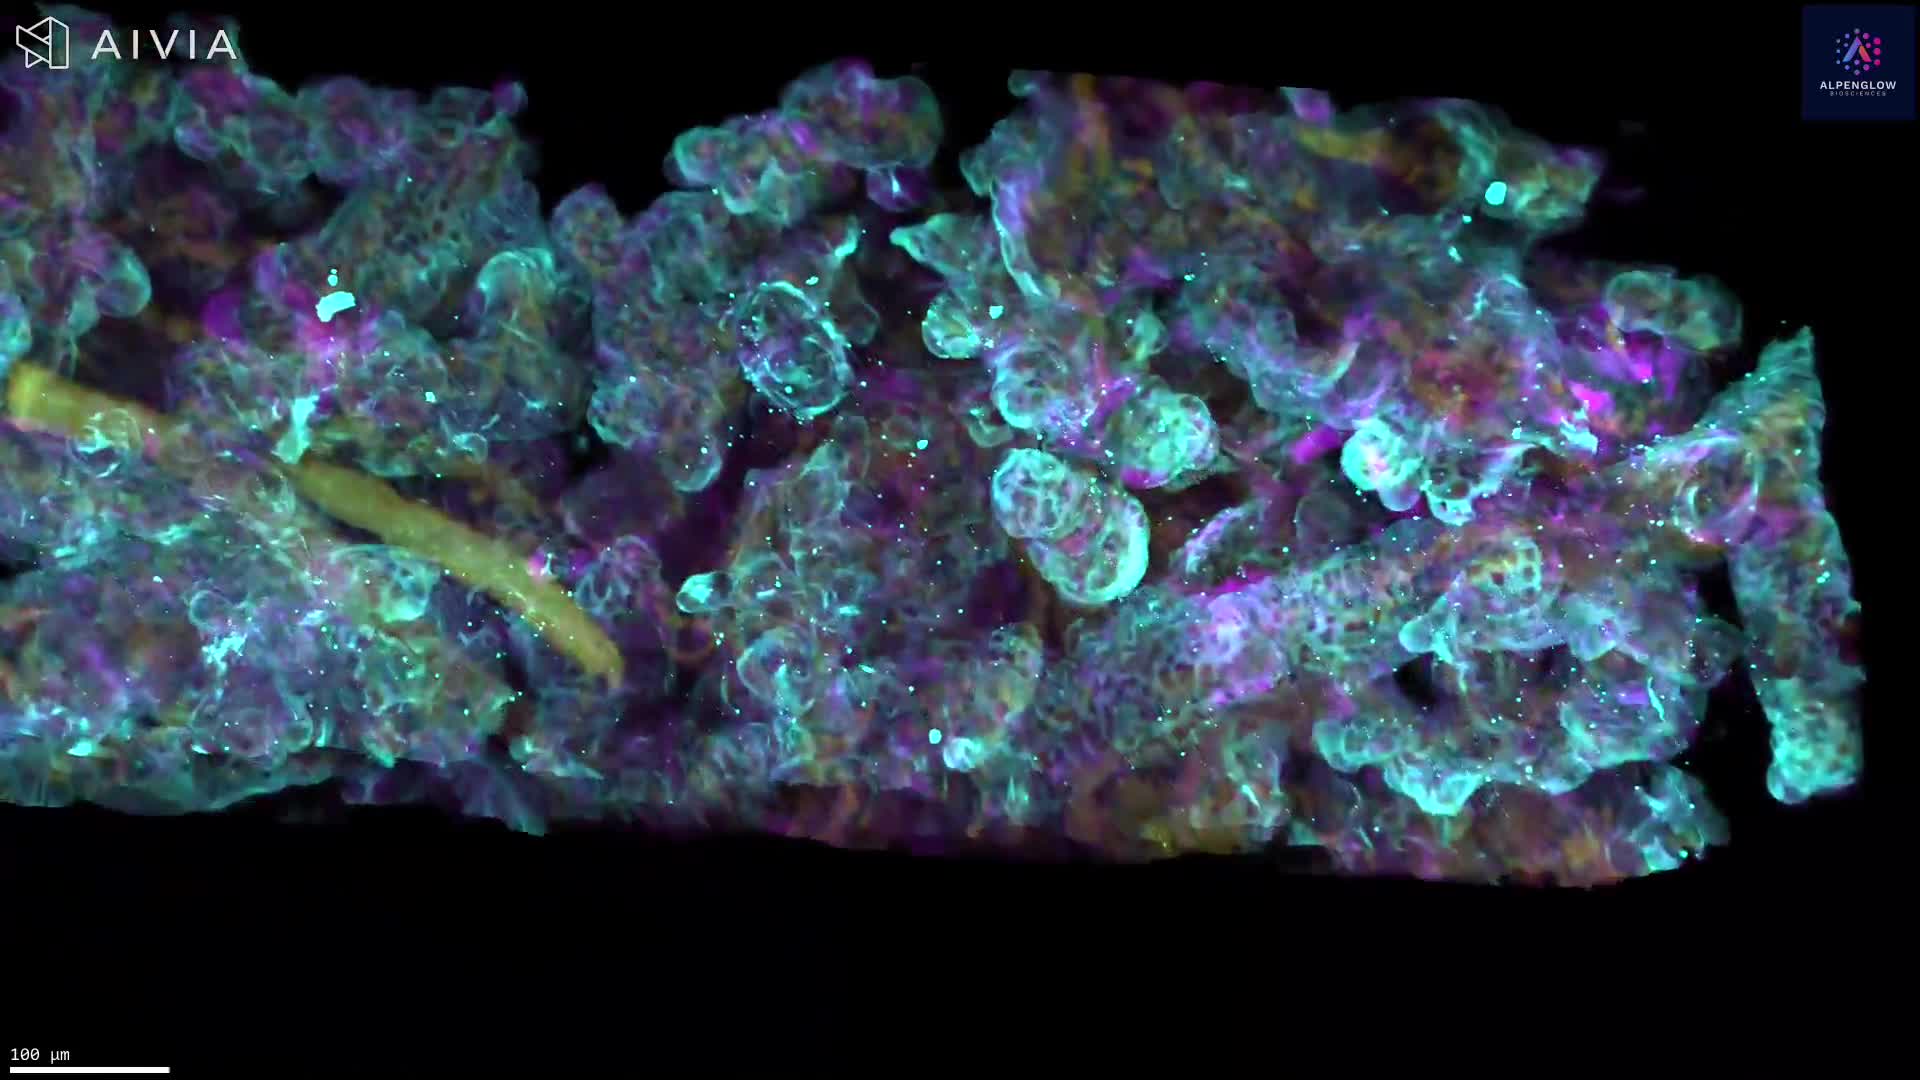
Volumetric 3D imaging of human placental tissue reveals the distribution of PD-L1 signal across the tissue architecture and depth, enabling spatial investigation of placental biology and the maternal-fetal interface.
This video presents a volumetric view of human placental tissue, with PD-L1 signal shown in cyan across the imaged tissue architecture.
PD-L1 is an immune-regulatory protein expressed in placental tissue and is relevant to research on trophoblast biology and the maternal-fetal interface. Viewing the signal in 3D preserves its distribution across depth and provides spatial context that cannot be captured from a single tissue section.
The volumetric dataset can support analysis of PD-L1-positive regions, signal distribution, tissue coverage, and spatial relationships with additional cellular or structural markers when included in a multiplex panel.
The tissue was imaged using the Aurora 3D™ Spatial Biology Solution, including the 3Di™ Hybrid Open-Top Light-Sheet microscope.
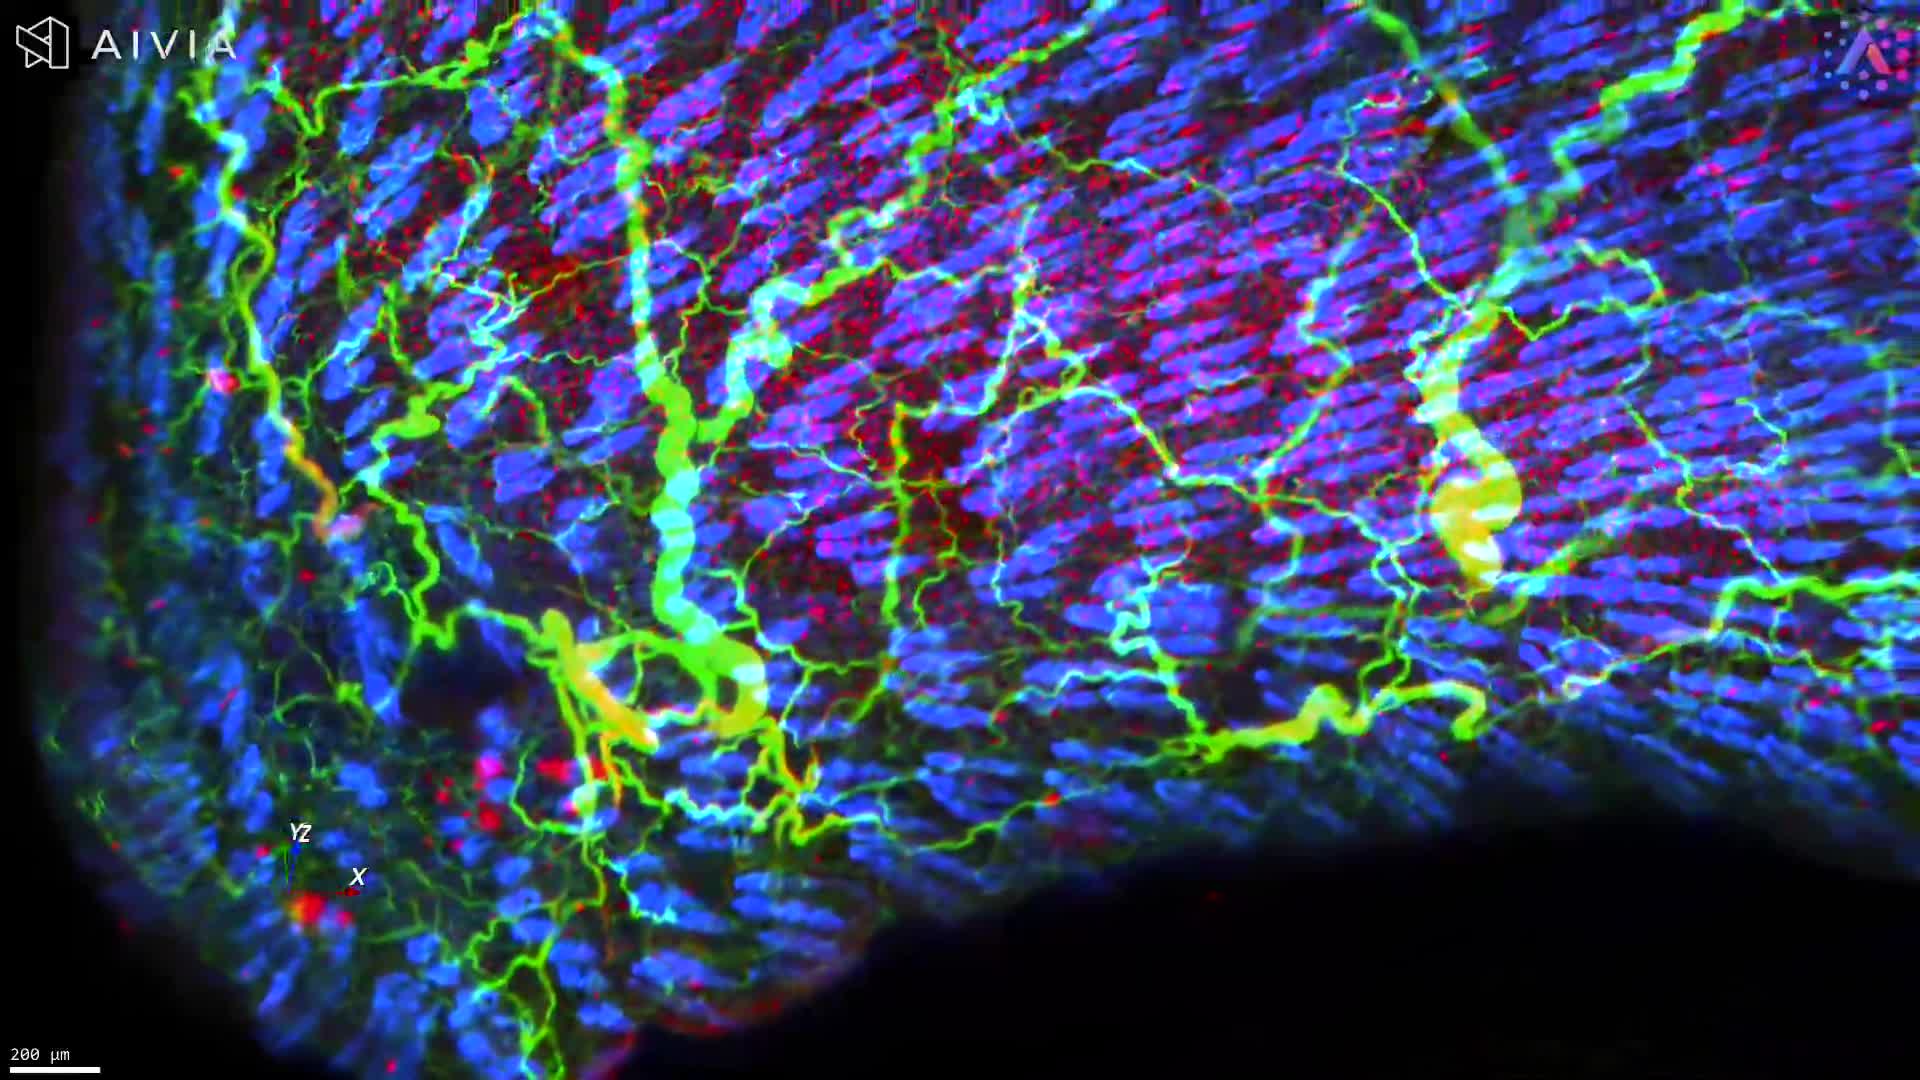
3D fluorescence imaging of mouse skin reveals the continuity and branching of sensory nerve networks across tissue depth. PGP9.5 highlights broader nerve architecture, while the Nav1.8-associated signal identifies a subset of sensory neurons.
This dataset presents mouse skin tissue imaged in 3D using fluorescence labeling. PGP9.5 highlights the broader nerve network, YO-PRO-1 labels nuclei, and Nav1.8-associated signal identifies a subset of sensory neurons.
The volumetric view preserves the continuity of nerve fibers across the imaged tissue depth, revealing large nerve bundles, finer branches, crossings, and terminal structures within dermal and epidermal regions.
With appropriate segmentation, the dataset can support measurement of nerve density, fiber length, branching, orientation, and spatial relationships with surrounding cells and tissue structures. These features are relevant to research on cutaneous innervation, sensory biology, pain, itch, inflammation, and treatment-associated changes in nerve architecture.
The tissue was imaged using the Aurora 3D™ Spatial Biology Solution, including the 3Di™ Hybrid Open-Top Light-Sheet microscope.
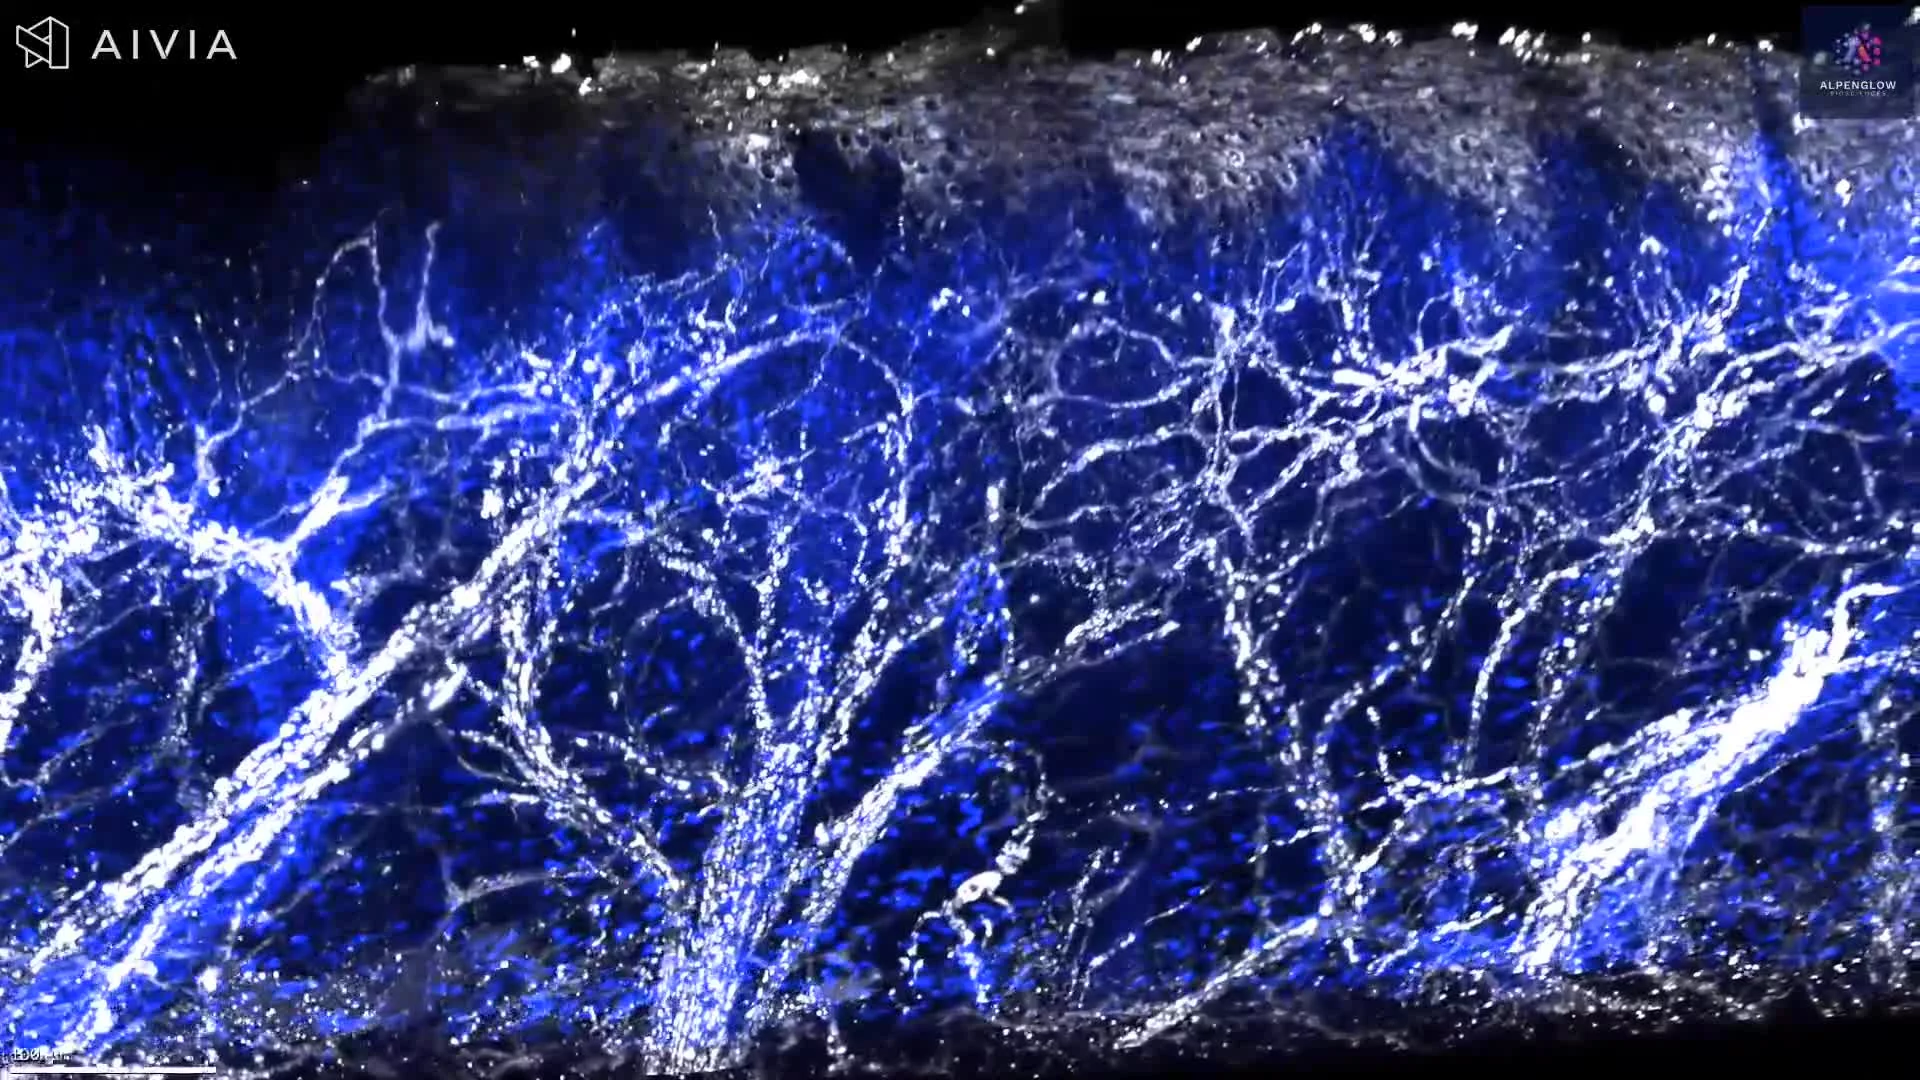
Volumetric 3D imaging of rat toe pad skin reveals cutaneous nerve fibers, branching, and terminal structures at the dermal–epidermal junction using PGP9.5 and YO-PRO-1 staining.
This dataset presents volumetric 3D imaging of rat toe pad skin, revealing cutaneous nerve architecture at the dermal–epidermal junction.
PGP9.5 highlights nerve fibers in white, while YO-PRO-1 labels nuclei in blue. The intact tissue volume preserves the continuity of larger nerve bundles, finer branches, fiber crossings, and terminal structures across tissue depth.
With appropriate segmentation, the dataset can support quantitative analysis of nerve density, fiber length, branching, orientation, and the distribution of nerve fibers relative to the epidermis and surrounding cells. These measurements are relevant to studies of cutaneous innervation, sensory biology, neuro-immune interactions, pain, itch, and disease-associated changes in nerve architecture.
The tissue was imaged using the Aurora 3D™ Spatial Biology Solution, including the 3Di™ Hybrid Open-Top Light-Sheet microscope.
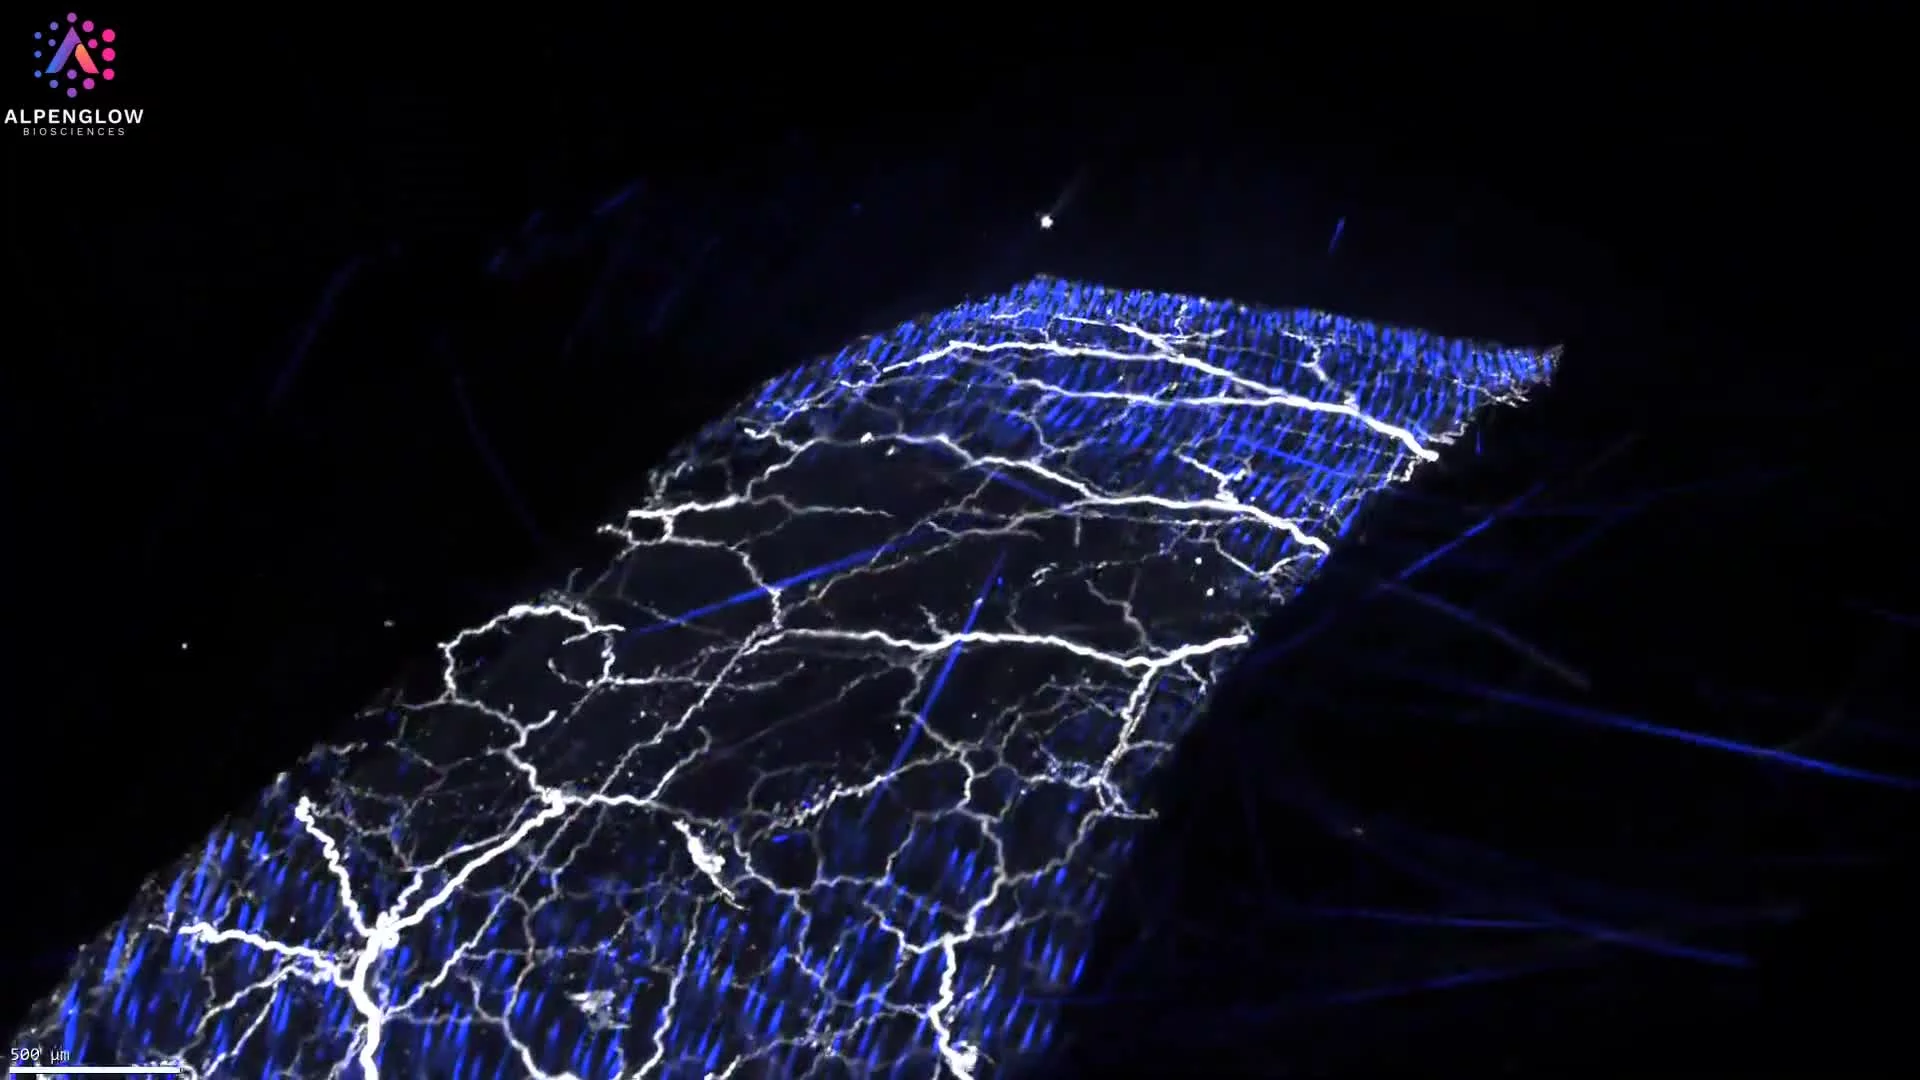
3D imaging of mouse skin reveals how larger dermal nerve bundles divide into progressively finer branches across the tissue volume. YO-PRO-1 labels nuclei, while PGP9.5 highlights cutaneous nerve architecture.
This dataset presents mouse skin tissue imaged in 3D, with YO-PRO-1 labeling nuclei and PGP9.5 highlighting cutaneous nerve structures.
The volumetric view reveals larger nerve bundles within the dermis as they divide into progressively finer branches and projections across the imaged tissue volume. Preserving these structures in 3D makes it possible to follow nerve continuity, branching patterns, orientation, and relationships with surrounding cells and tissue compartments.
With appropriate segmentation, the dataset can support measurement of nerve density, fiber length, branching frequency, tortuosity, orientation, and regional variation. These features are relevant to research on cutaneous innervation, sensory biology, neuro-immune interactions, pain, itch, and changes associated with disease or treatment.
The tissue was imaged using the Aurora 3D™ Spatial Biology Solution, including the 3Di™ Hybrid Open-Top Light-Sheet microscope.
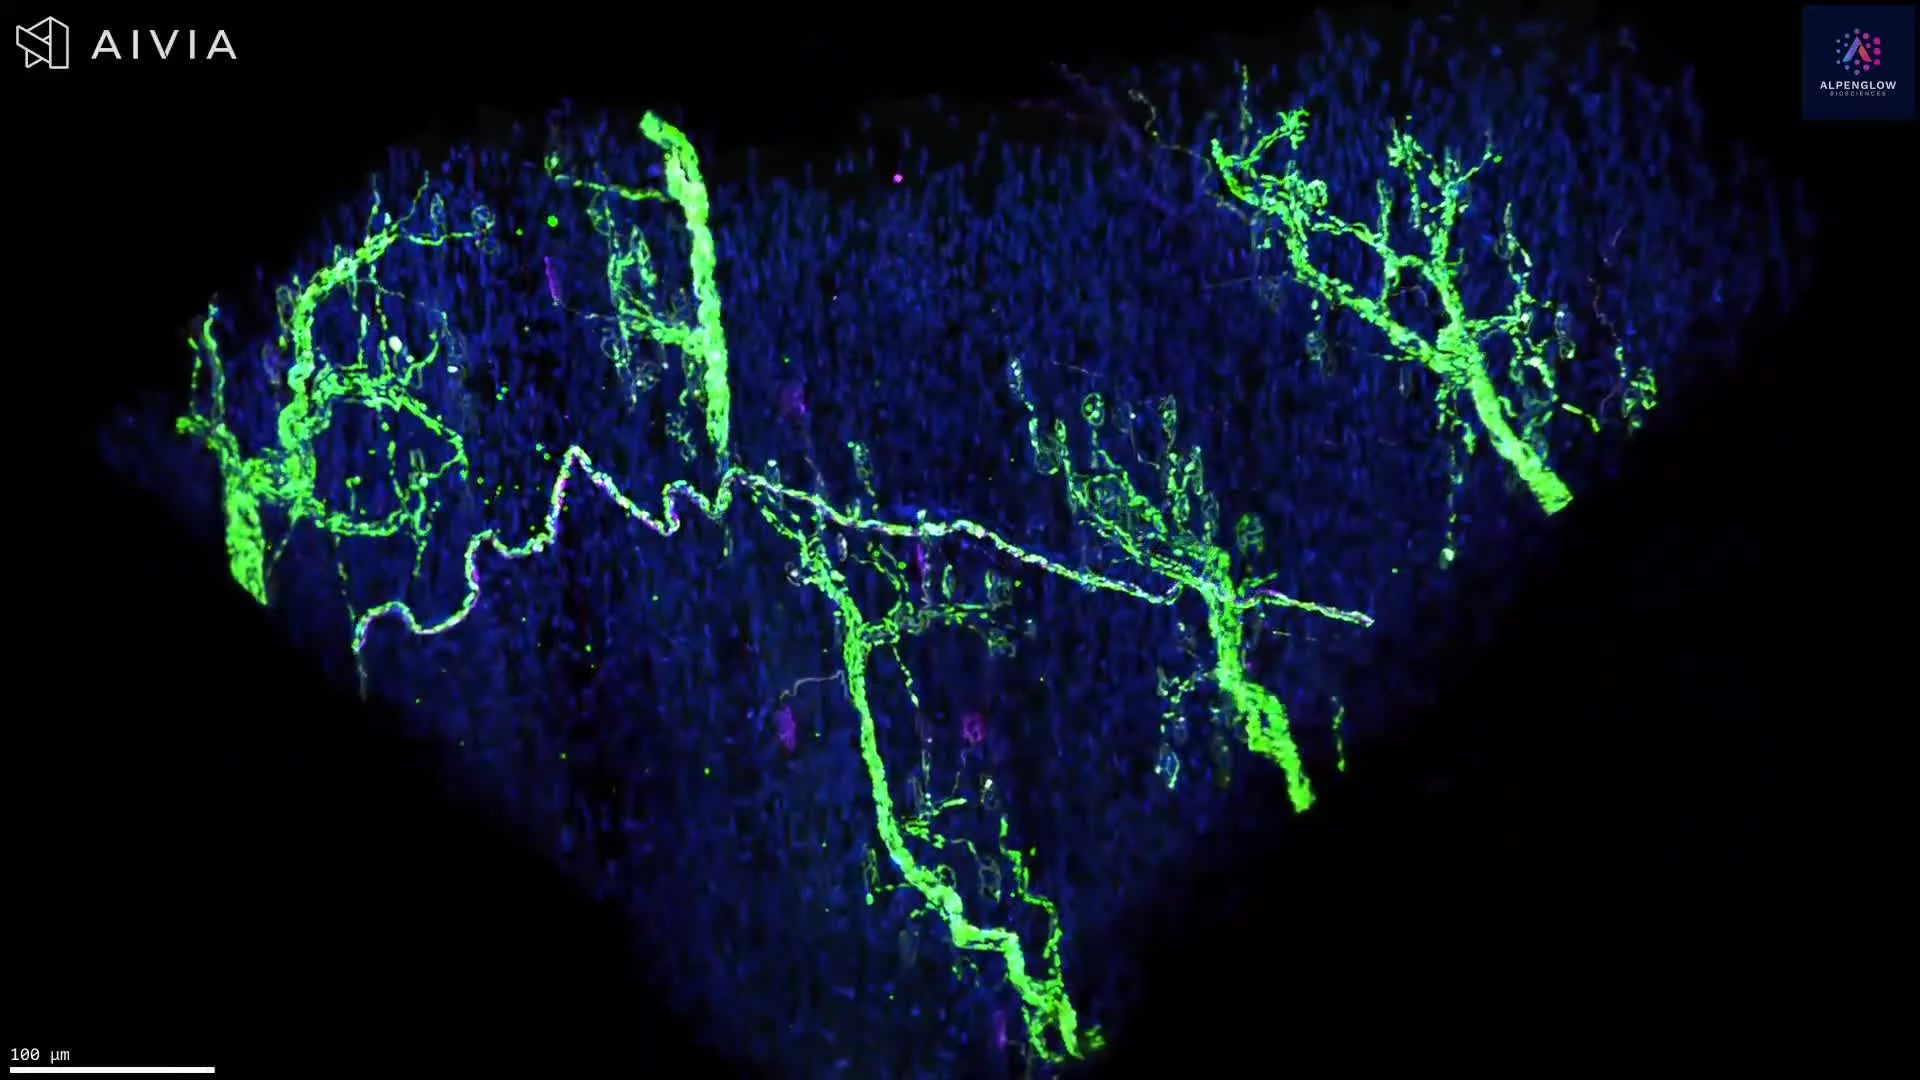
Volumetric 3D imaging of mouse skeletal muscle reveals axonal trajectories and branching across tissue depth. NF200 highlights larger-caliber nerve fibers, PGP9.5 visualizes the broader neuronal network, and YO-PRO-1 labels nuclei.
This dataset presents volumetric 3D imaging of mouse skeletal muscle stained with NF200, PGP9.5, and YO-PRO-1.
NF200, shown in green, highlights neurofilament heavy chain in larger-caliber axons and reveals major neural trajectories. PGP9.5, shown in magenta, visualizes the broader axonal network throughout the muscle. YO-PRO-1, shown in blue, labels nuclei and provides cellular context across the tissue volume.
The 3D view preserves axonal trajectories, branching patterns, and regional innervation across depth. With appropriate segmentation, the dataset can support measurements of axon length, branching complexity, regional nerve density, orientation, and spatial distribution.
Explore how 3D tissue imaging supports dermatology research across skin architecture, innervation, immune organization, and spatial relationships.
The tissue was imaged using the Aurora 3D™ Spatial Biology Solution, including the 3Di™ Hybrid Open-Top Light-Sheet microscope.
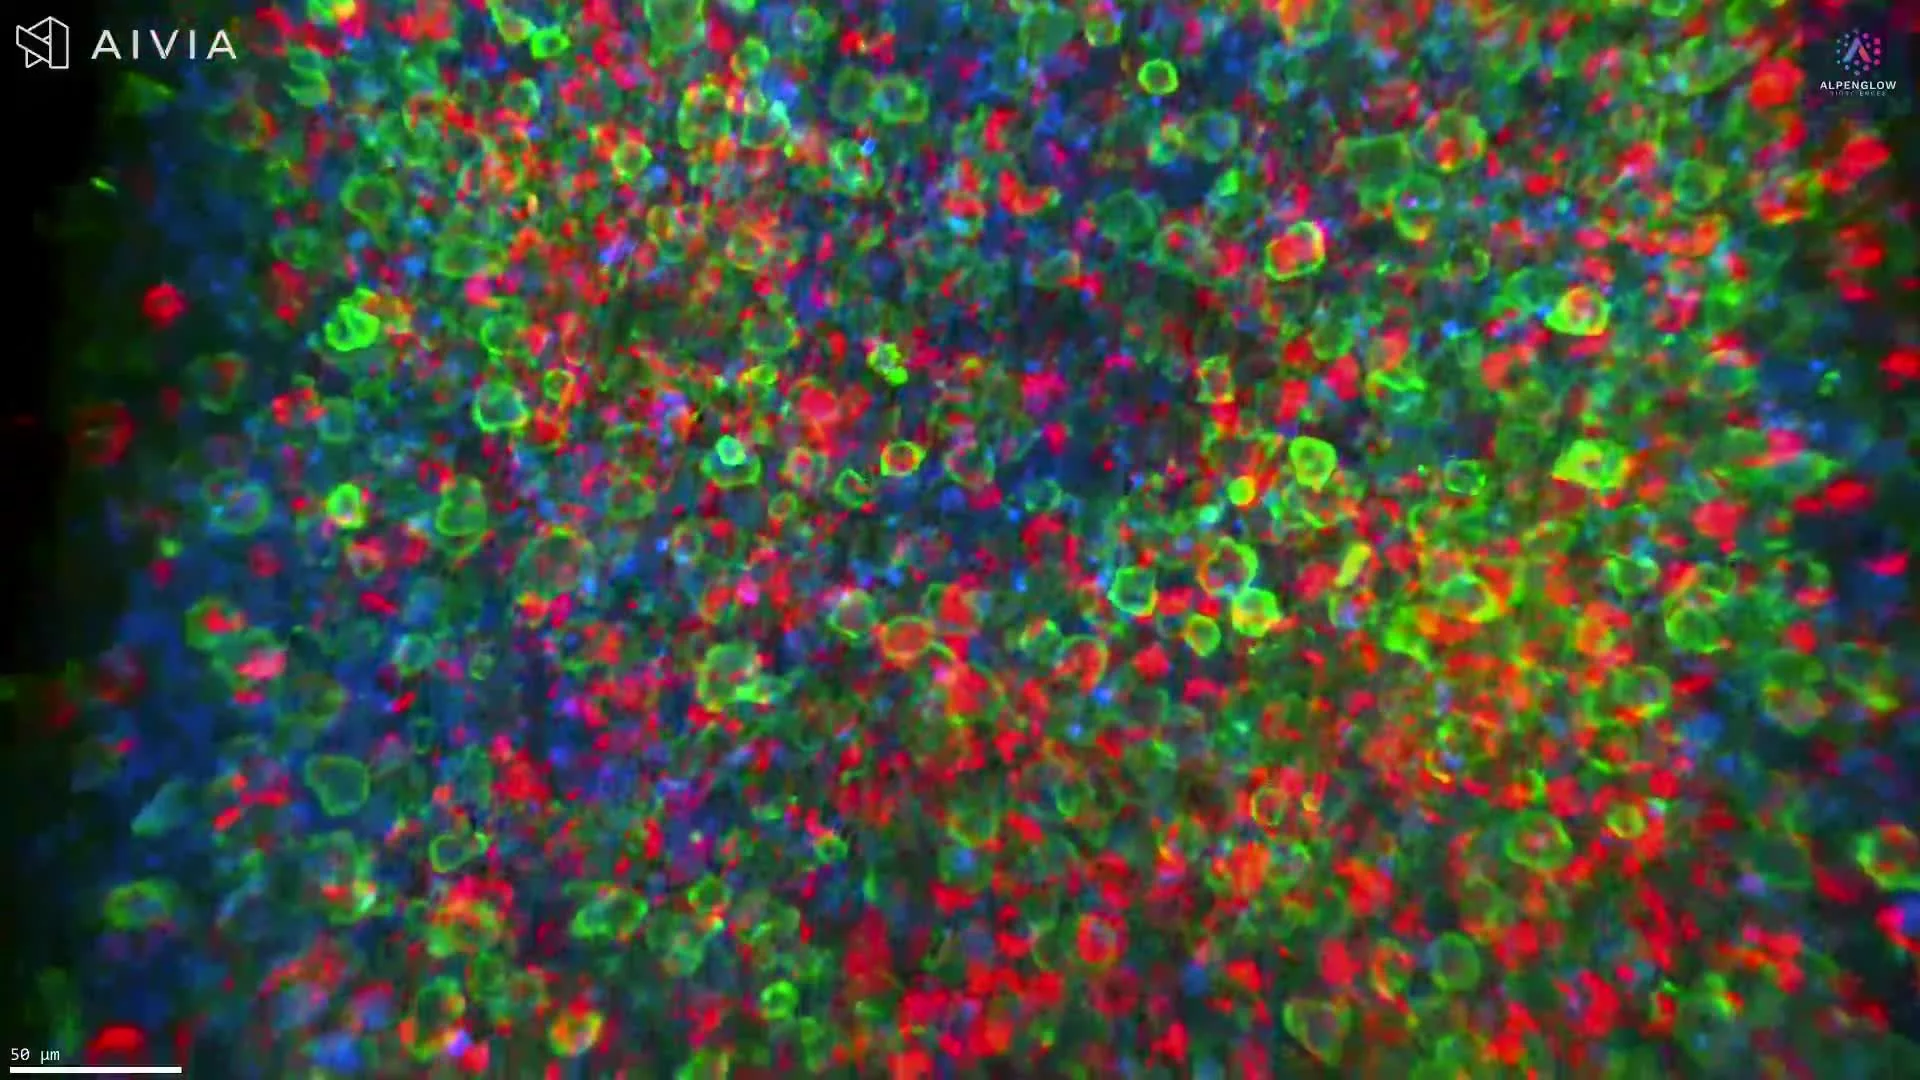
3D imaging of an intact mouse colorectal tumor reveals immune organization across the full tissue volume. B220-positive regions are shown in green, CD3-positive T cells in red, and nuclei in blue.
This video presents high-resolution 3D imaging of an intact mouse colorectal tumor, preserving immune organization across the full tissue volume.
B220, shown in green, highlights B-cell-rich regions. CD3, shown in red, identifies T-cell populations, while nuclei are shown in blue to provide cellular and tissue context. Together, these markers reveal how immune cells are distributed, clustered, and spatially organized within the tumor.
The volumetric dataset preserves regional heterogeneity and relationships between B-cell-rich and T-cell-rich areas across depth. With appropriate segmentation, it can support quantitative analysis of immune-cell density, clustering, spatial distribution, and distances between immune populations and surrounding tumor regions.
Explore how 3D tissue imaging supports immuno-oncology research across tumor architecture, immune-cell organization, and spatial relationships.
The tissue was imaged using the Aurora 3D™ Spatial Biology Solution, including the 3Di™ Hybrid Open-Top Light-Sheet microscope.
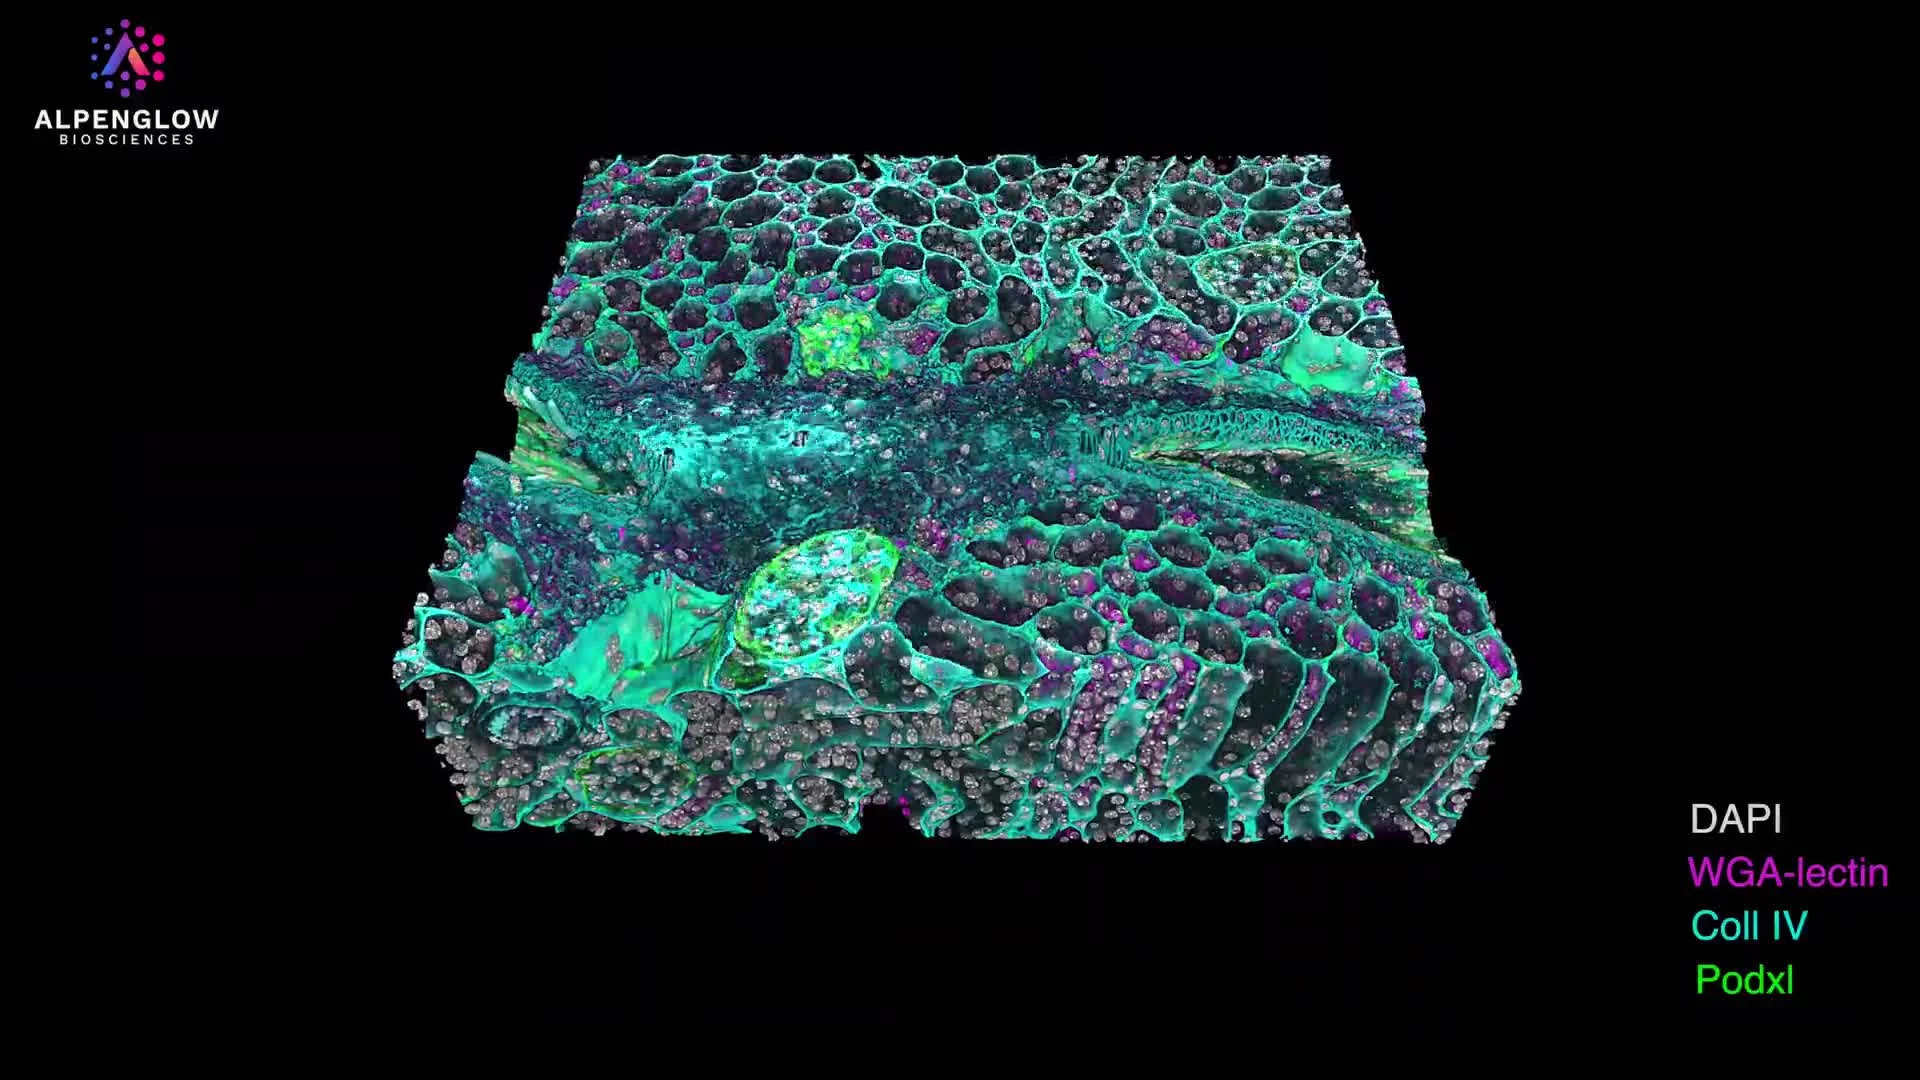
Expanded 3D imaging of mouse kidney tissue reveals glomerular and basement membrane architecture across an intact volume.
This video presents expanded 3D imaging of mouse kidney tissue, revealing glomerular, basement membrane, and extracellular matrix architecture across an intact tissue volume.
Nuclei are shown in white. Collagen IV, shown in blue, highlights basement membrane structures. WGA lectin, shown in magenta, labels glycoprotein-rich tissue features, while podocalyxin, shown in green, highlights podocyte-associated structures within the glomeruli.
Expansion microscopy physically enlarges the specimen, increasing the separation between fluorescently labeled structures while preserving their relative spatial organization. Traversing the expanded volume reveals the three-dimensional relationships among glomeruli, basement membranes, and surrounding renal tissue that can appear fragmented in individual 2D sections.
The dataset can support analysis of glomerular morphology, basement membrane organization, spatial distribution, and structural variation across the imaged kidney volume.
This work was performed in collaboration with Joshua Vaughan and the University of Washington Department of Chemistry.
The tissue was imaged using the Aurora 3D™ Spatial Biology Solution, including the 3Di™ Hybrid Open-Top Light-Sheet microscope.
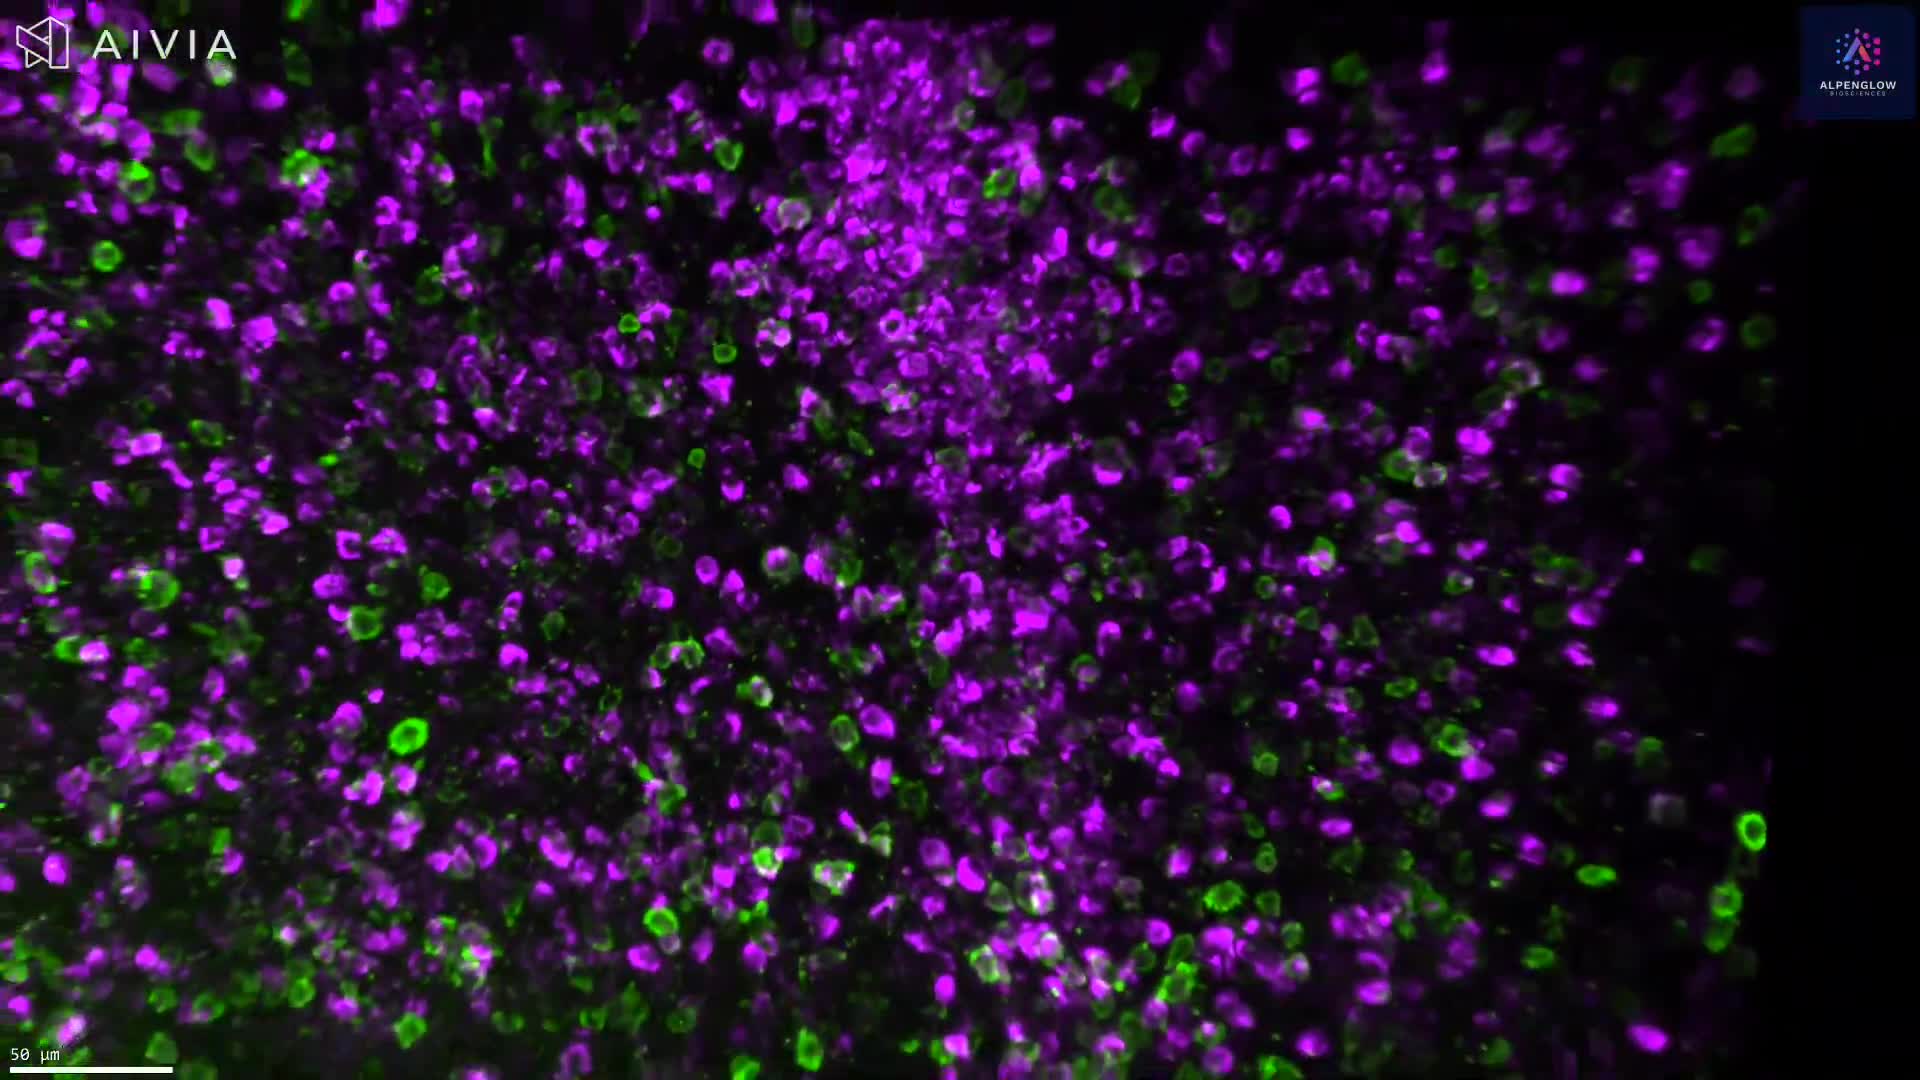
High-resolution 3D imaging of an intact mouse colorectal tumor reveals TLS-associated immune organization across tissue depth. B220-positive regions are shown in green, CD3-positive regions in magenta, and nuclei in blue.
This video presents high-resolution 3D imaging of an intact mouse colorectal tumor, revealing TLS-associated immune organization across the tissue volume.
B220, shown in green, highlights B-cell-rich regions. CD3, shown in magenta, identifies T-cell-rich regions, while nuclei are shown in blue to provide cellular and tissue context. Together, these markers reveal the spatial arrangement of B- and T-cell populations within organized immune aggregates.
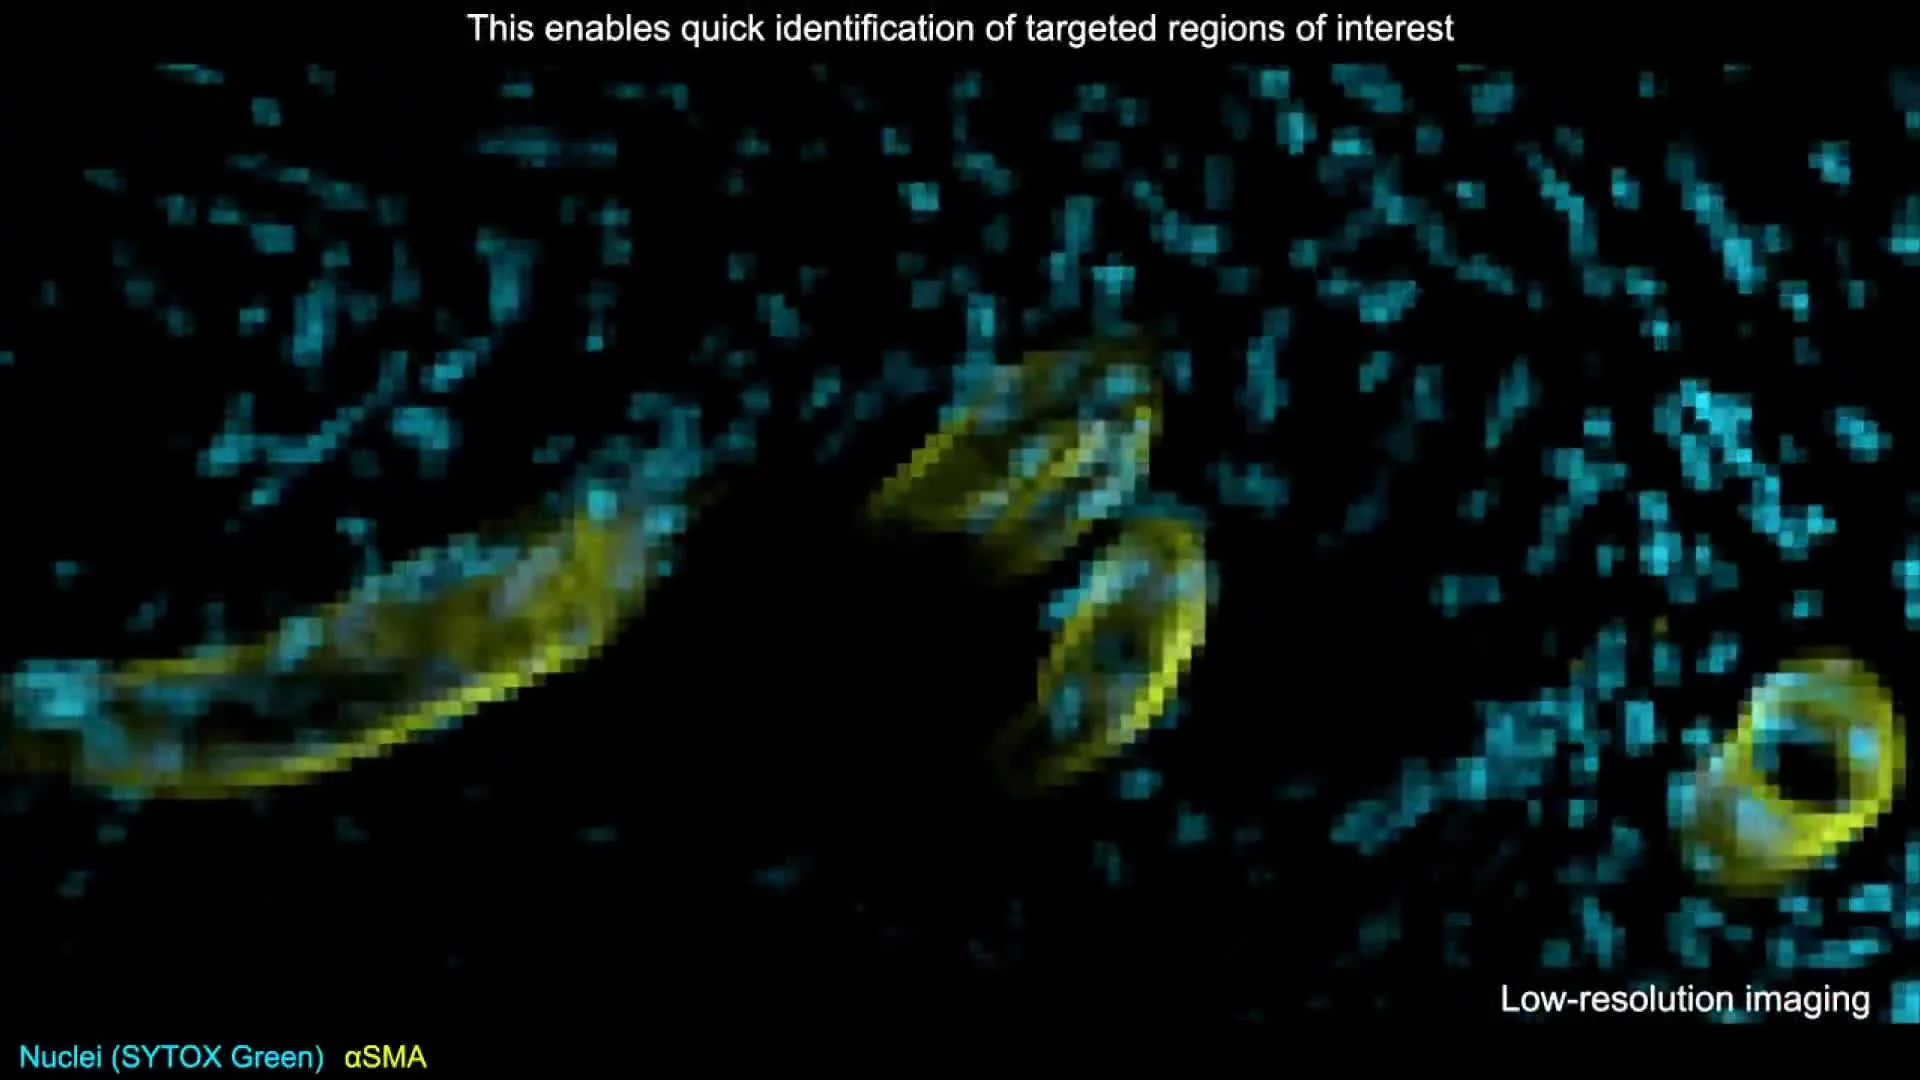
The workflow begins with volumetric screening of the cleared tumor to identify regions containing dense B220 and CD3 signal. Selected regions are then imaged at higher resolution, preserving their position within the surrounding tumor while revealing cellular organization in greater detail.
With appropriate segmentation and validated TLS criteria, the dataset can support analysis of aggregate numbers, volume, distribution, cellular organization, and spatial relationships with surrounding tumor regions.
Explore how 3D tissue imaging supports immuno-oncology research across tumor architecture, immune-cell organization, and spatial relationships.
The tissue was imaged using the Aurora 3D™ Spatial Biology Solution, including the 3Di™ Hybrid Open-Top Light-Sheet microscope.
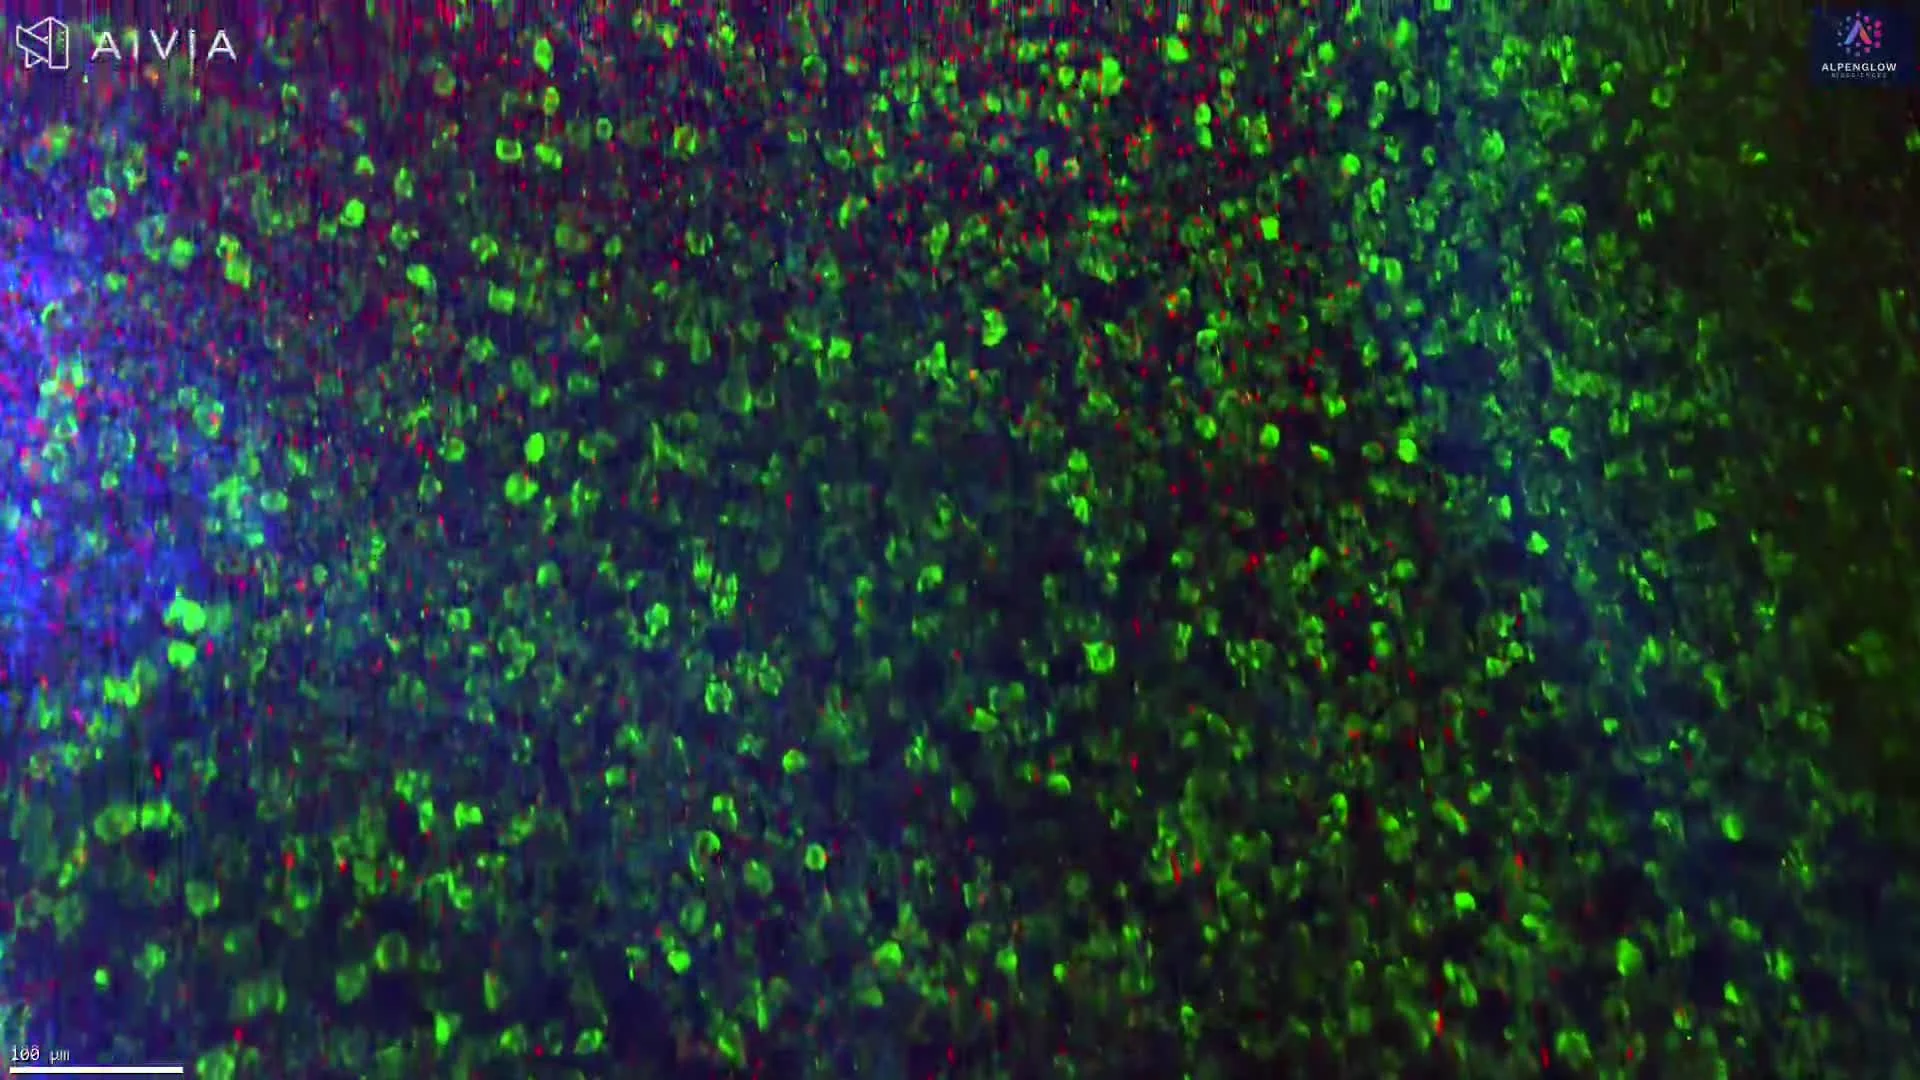
3D light-sheet imaging of an intact mouse colorectal tumor maps B220-positive B-cell populations in green and CD3-positive T-cell populations in magenta, preserving cellular organization across the full tissue depth.
This video presents 3D tissue imaging of an intact mouse colorectal tumor using light-sheet fluorescence microscopy.
B220, shown in green, highlights B-cell populations, while CD3, shown in magenta, identifies T-cell populations. Individual labeled cells can be resolved while their positions remain connected to the surrounding tumor architecture.
The volumetric view reveals differences in immune cell density, clustering, and spatial distribution throughout the tumor. Unlike measurements based on selected tissue sections, imaging the intact volume preserves immune organization across depth and supports analysis from cellular detail to tissue-scale patterns.
With appropriate segmentation, the dataset can support quantitative analysis of B220-positive and CD3-positive cell densities, clustering, regional distributions, and spatial relationships among immune populations. Organized immune aggregates can also be located for further characterization using additional markers and validated tertiary lymphoid structure criteria.
Explore how 3D tissue imaging supports immuno-oncology research across tumor architecture, immune-cell organization, and spatial relationships.
The tissue was imaged using the Aurora 3D™ Spatial Biology Solution, including the 3Di™ Hybrid Open-Top Light-Sheet microscope.
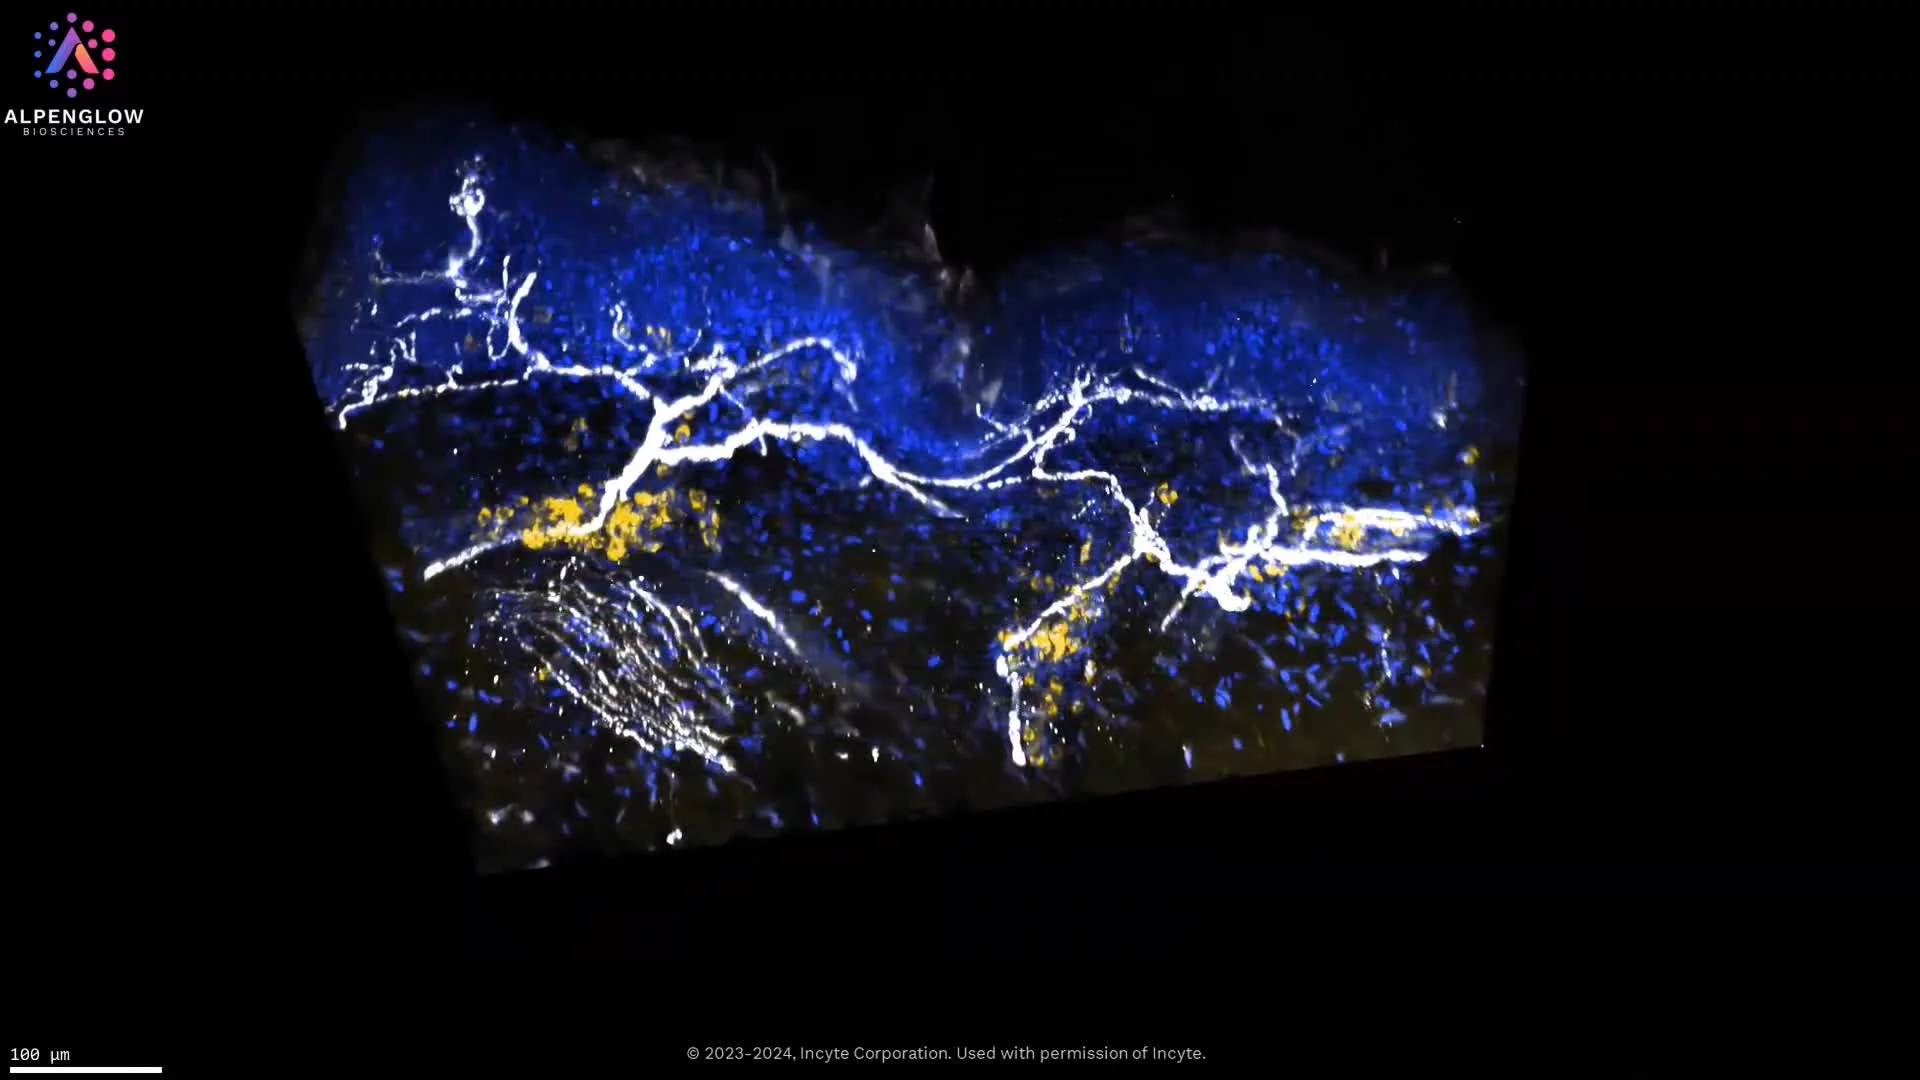
High-resolution 3D imaging of atopic dermatitis reveals lymphocyte clusters near nerves, stained with TO-PRO-3, PGP 9.5, and CD45. Explore detailed innervation and immune-cell interactions in lesional skin.
This high-resolution 3D visualization of lesional atopic dermatitis skin tissue reveals the spatial relationship between cutaneous nerves and CD45-positive immune cells.
Using high-resolution 40X HOTLS imaging, TO-PRO-3, shown in blue, labels nuclei. PGP9.5, shown in white, traces nerve fibers, while CD45, shown in yellow, highlights immune cells across the tissue volume.
The volumetric view preserves epidermal and dermal architecture while revealing clusters of CD45-positive immune cells near selected nerve fibers across tissue depth. This spatial proximity provides a tissue-wide view of neuro-immune organization without implying a functional interaction from imaging alone.
With appropriate segmentation, the dataset supports measurement of immune-cell density, nerve density, clustering, distances between immune cells and nerves, and regional variation across skin compartments. These readouts are relevant to research on inflammatory skin diseases and the neuroimmune mechanisms underlying itch and inflammation.
Explore how 3D tissue imaging supports dermatology research across skin architecture, innervation, immune organization, and spatial relationships.
The tissue was imaged using the Aurora 3D™ Spatial Biology Solution, including the 3Di™ Hybrid Open-Top Light-Sheet microscope.
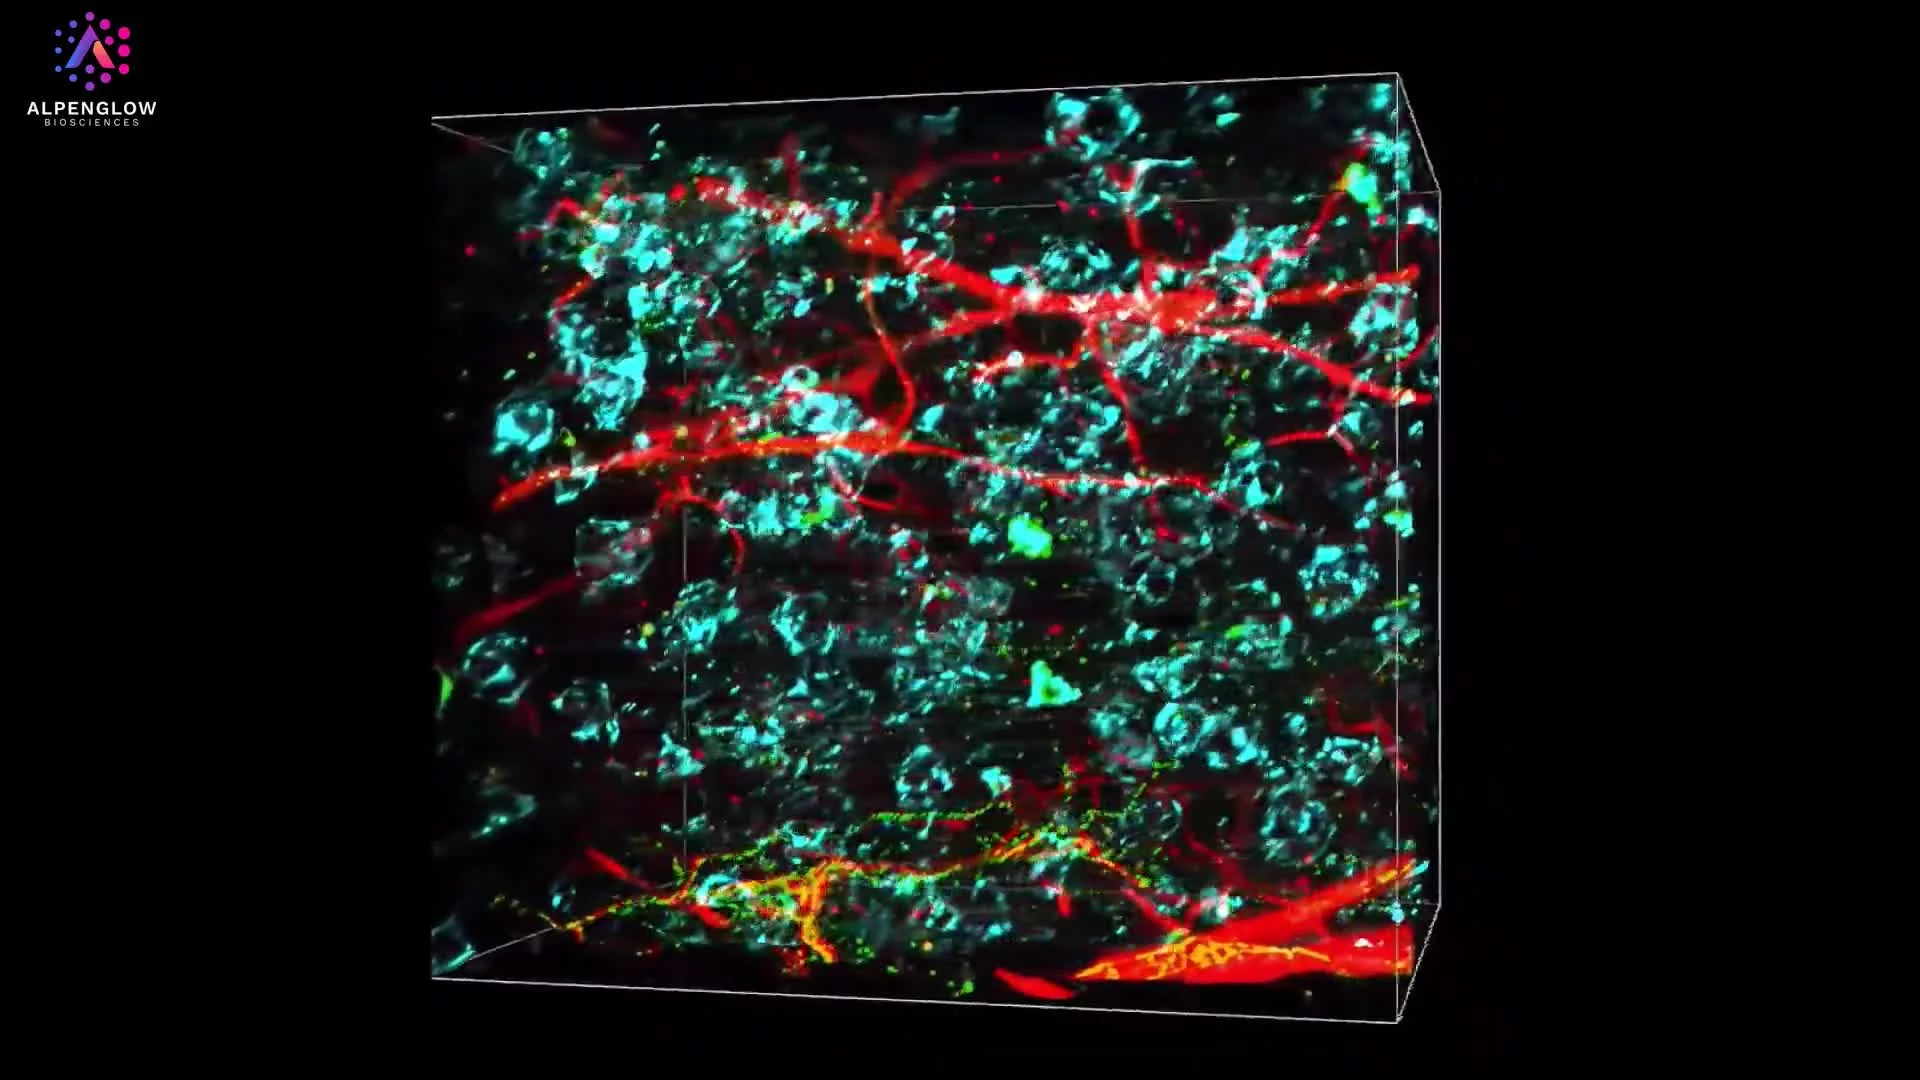
3D imaging of cleared mouse fat pad reveals blood vessels, macrophages, and nerves labeled with lectin, CD68, and PGP9.5.
This dataset presents a cleared, triple-labeled mouse fat pad imaged in 3D, preserving vascular, immune, and neural structures across the intact tissue volume.
Lectin, shown in red, highlights the vascular network. CD68, shown in turquoise, identifies macrophage-associated cells, while PGP9.5, shown in green, traces nerve fibers throughout the adipose tissue.
The volumetric view reveals the distribution and spatial relationships of blood vessels, CD68-positive cells, and nerves within the surrounding tissue architecture. Preserving these structures across depth enables investigation of immune–neural–vascular organization that can be fragmented or missed in selected 2D sections.
The dataset supports quantitative analysis of vascular density and branching, nerve density and trajectory, CD68-positive cell distribution, and distances among immune, vascular, and neural structures. These measurements are relevant to preclinical studies of adipose tissue biology, inflammation, remodeling, metabolism, and neurovascular organization.
The tissue was imaged using the Aurora 3D™ Spatial Biology Solution, including the 3Di™ Hybrid Open-Top Light-Sheet microscope.
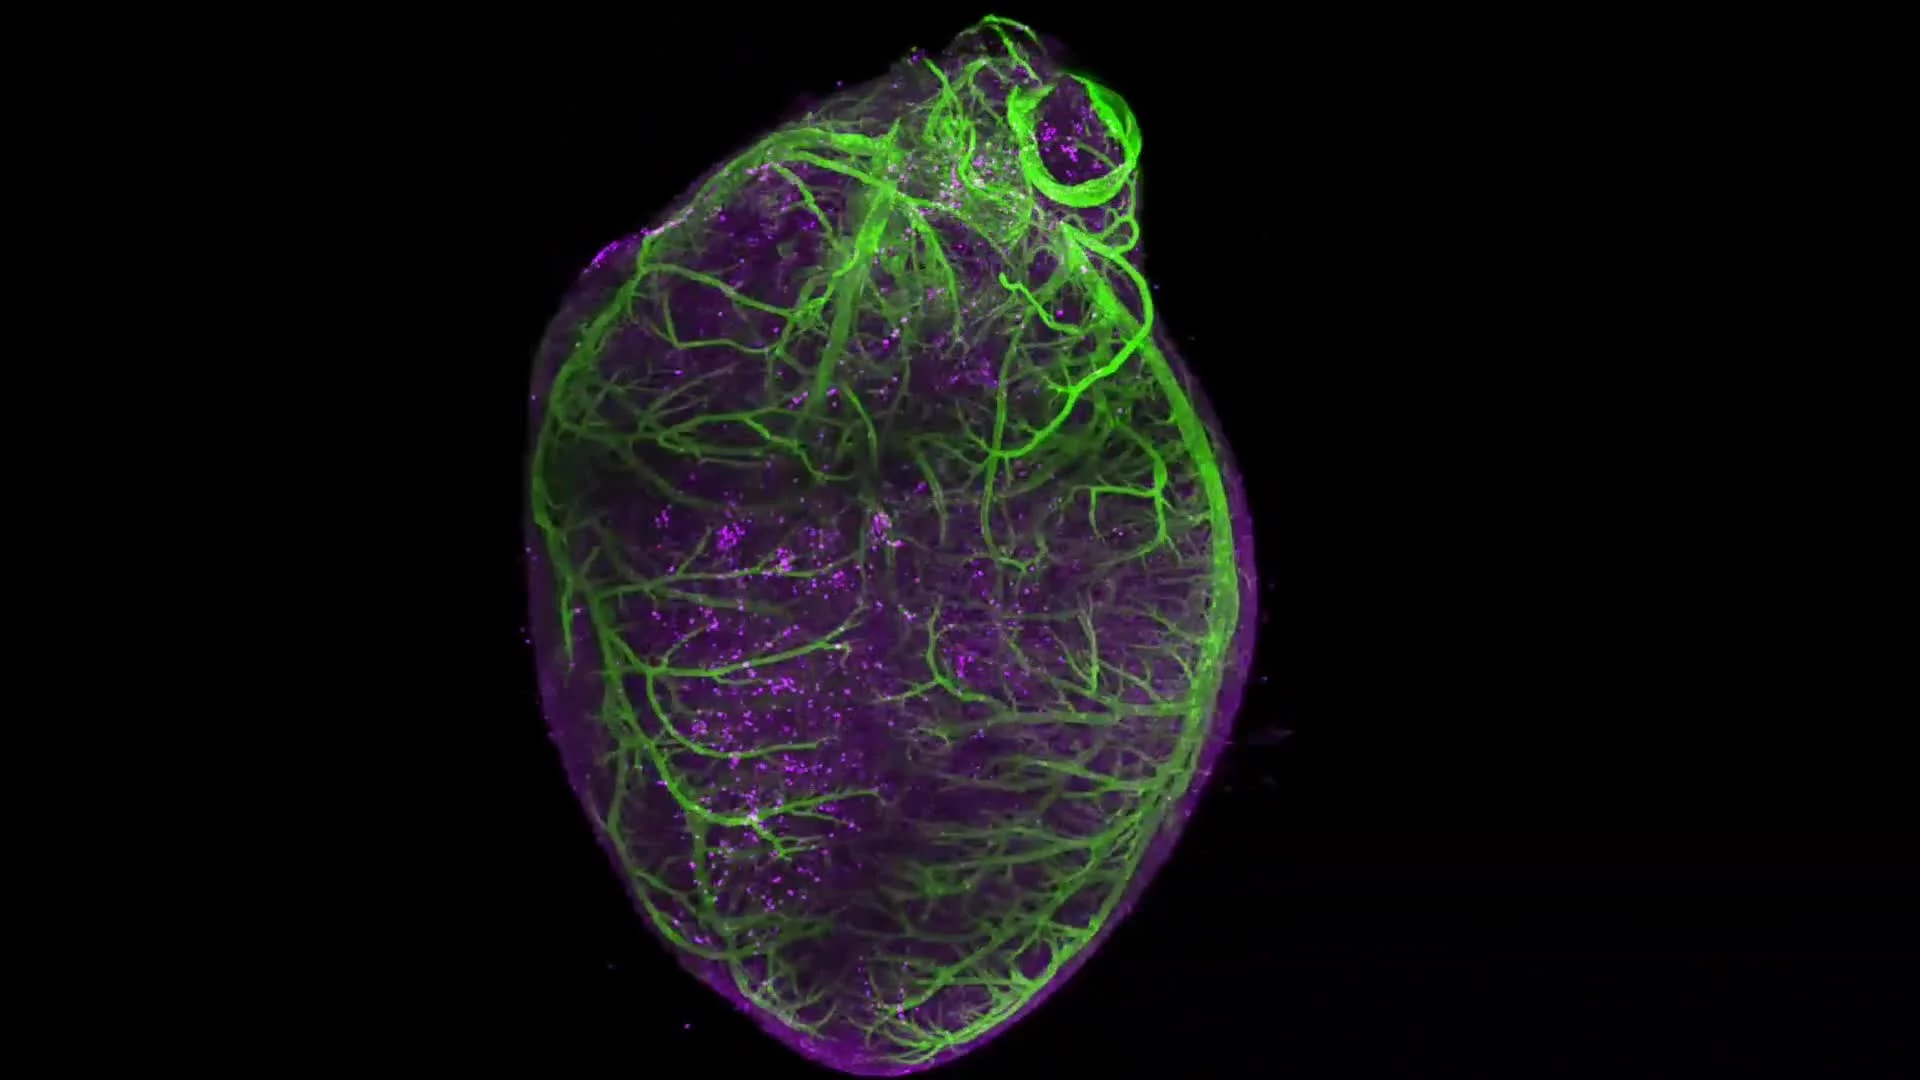
Whole-organ 3D imaging of a murine heart combines Scout and high-resolution Zoom imaging to reveal vascular branching and vessel-associated mural cell organization across scales.
This dataset presents a whole murine heart imaged in 3D, preserving vascular and vessel-associated cellular architecture across the intact organ.
Smooth muscle actin, shown in green, highlights SMA-positive structures associated with the vasculature. A mural-cell-associated signal, shown in purple, reveals vessel-associated cells along the vascular network.
The video begins with larger vessels and progressively moves into selected regions, combining Scout imaging of the whole organ with high-resolution Zoom imaging of local vascular structures. This multiscale view reveals vessel branching and the organization of mural cells around vessels, including fine perivascular structures at cellular detail.
The dataset supports quantitative analysis of vessel density, branching, diameter, tortuosity, mural-cell distribution, and spatial proximity between vessel-associated cells and the vascular wall. These measurements are relevant to cardiovascular research, vascular biology, tissue remodeling, and preclinical studies of disease and treatment response.
The tissue was imaged using the Aurora 3D™ Spatial Biology Solution, including the 3Di™ Hybrid Open-Top Light-Sheet microscope.
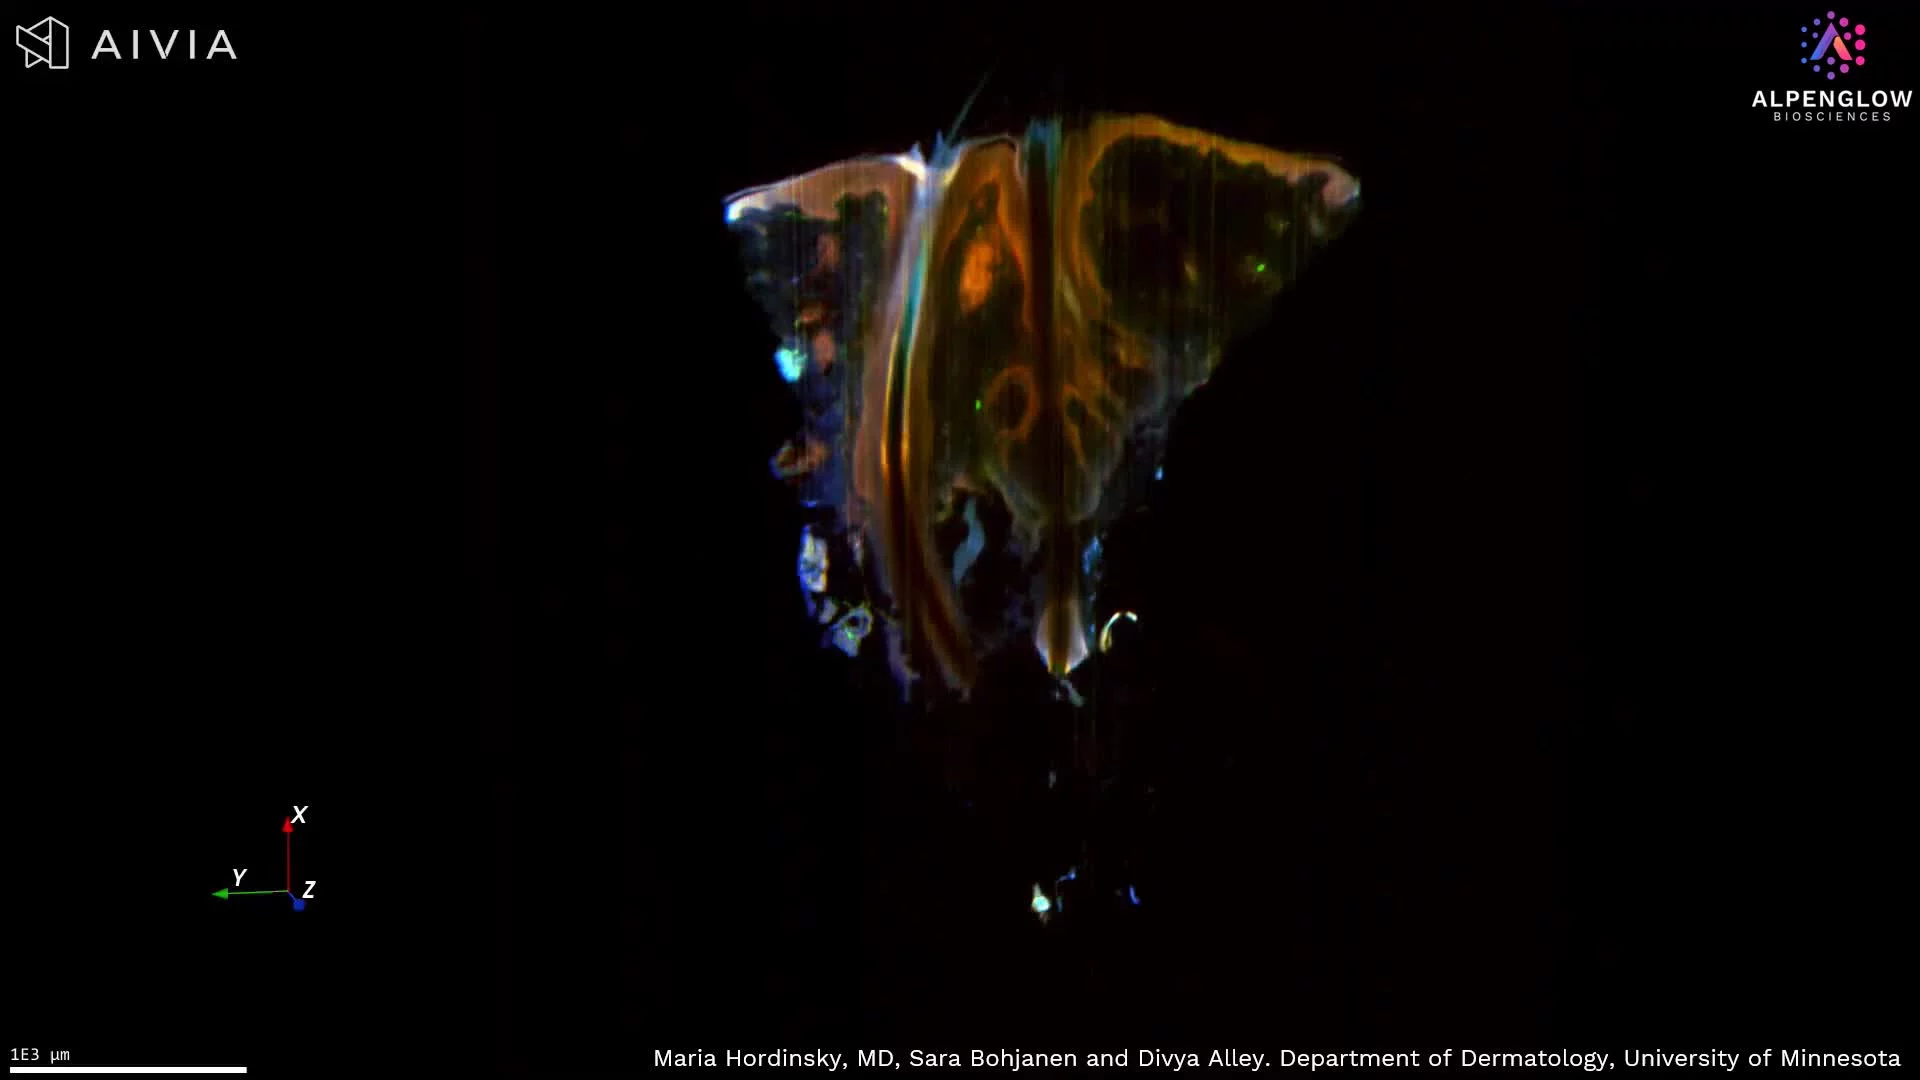
High-resolution 3D imaging of scalp tissue preserves hair follicle architecture, immune-cell distribution, and cutaneous nerve networks across depth, supporting spatial and quantitative analysis for hair and inflammatory skin research.
This high-resolution 3D dataset reveals scalp tissue architecture relevant to hair biology and inflammatory skin disease.
TO-PRO-3, shown in red, labels nuclei and highlights the epidermal and follicular cellular architecture. CD45, shown in blue, reveals the distribution of immune cells, while PGP9.5, shown in green, maps cutaneous nerve fibers across the tissue volume.
The volumetric view preserves intact hair follicles, including the hair bulb, along with surrounding immune cells and nerve networks. Following these structures through depth provides spatial information on follicle morphology, innervation, immune cell distribution, and relationships among skin compartments that may be fragmented in individual tissue sections.
The dataset supports quantitative analysis of follicle dimensions and orientation, immune-cell density and clustering, nerve density and branching, and distances between follicles, immune cells, and nerve fibers. These measurements are relevant to research on alopecia, atopic dermatitis, prurigo nodularis, hidradenitis suppurativa, and other inflammatory skin conditions.
Explore how 3D tissue imaging supports dermatology research across skin architecture, innervation, immune organization, and spatial relationships.
The tissue was imaged using the Aurora 3D™ Spatial Biology Solution, including the 3Di™ Hybrid Open-Top Light-Sheet microscope.
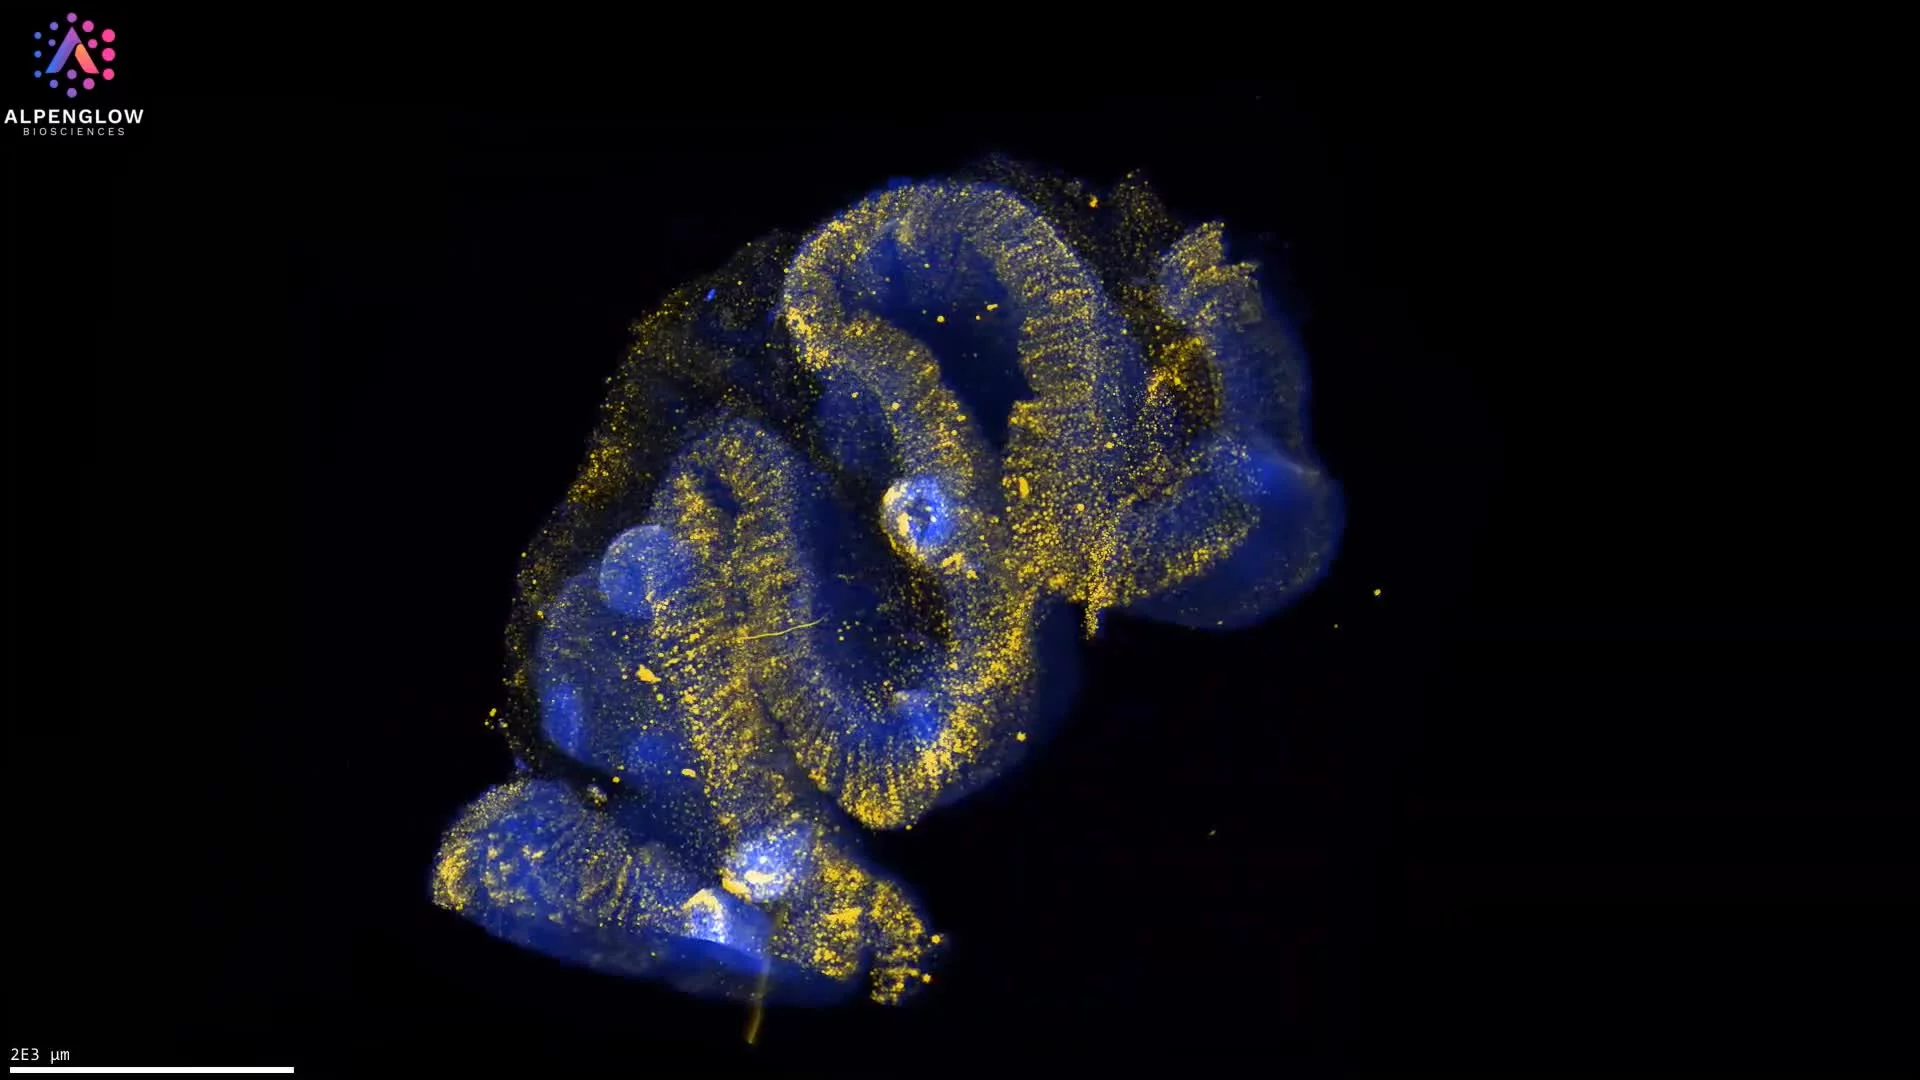
3D imaging and AI-powered analysis quantify CD8-positive cells within an approximately 6 × 4.3 × 4.2 mm volume of FFPE normal-adjacent colorectal tissue, preserving regional immune organization and heterogeneity across depth.
This dataset presents 3D imaging and quantitative analysis of human FFPE normal-adjacent colorectal tissue, preserving CD8-positive cell distribution across an approximately 6 × 4.3 × 4.2 mm tissue volume.
The FFPE tissue was deparaffinized, processed using a modified iDISCO+ clearing protocol, and stained with YO-PRO-1, shown in blue, to label nuclei and an anti-CD8 antibody, shown in yellow, to identify CD8-positive cells.
The tissue was acquired at 2 µm per pixel, providing a volumetric view of immune-cell distribution across depth. Unlike measurements derived from selected sections, the intact dataset captures regional variation in CD8-positive cell density, clustering, and spatial organization throughout the tissue volume.
Using 3Dm™ data management and 3Dai™ AI-powered segmentation, CD8-positive cells were quantified across the dataset. The resulting measurements support spatial profiling of immune infiltration, regional heterogeneity, cell density, clustering, and distances between CD8-positive cells and surrounding tissue structures.
Explore how 3D tissue imaging supports immuno-oncology research across tumor architecture, immune-cell organization, and spatial relationships.
The tissue was imaged using the Aurora 3D™ Spatial Biology Solution, including the 3Di™ Hybrid Open-Top Light-Sheet microscope.
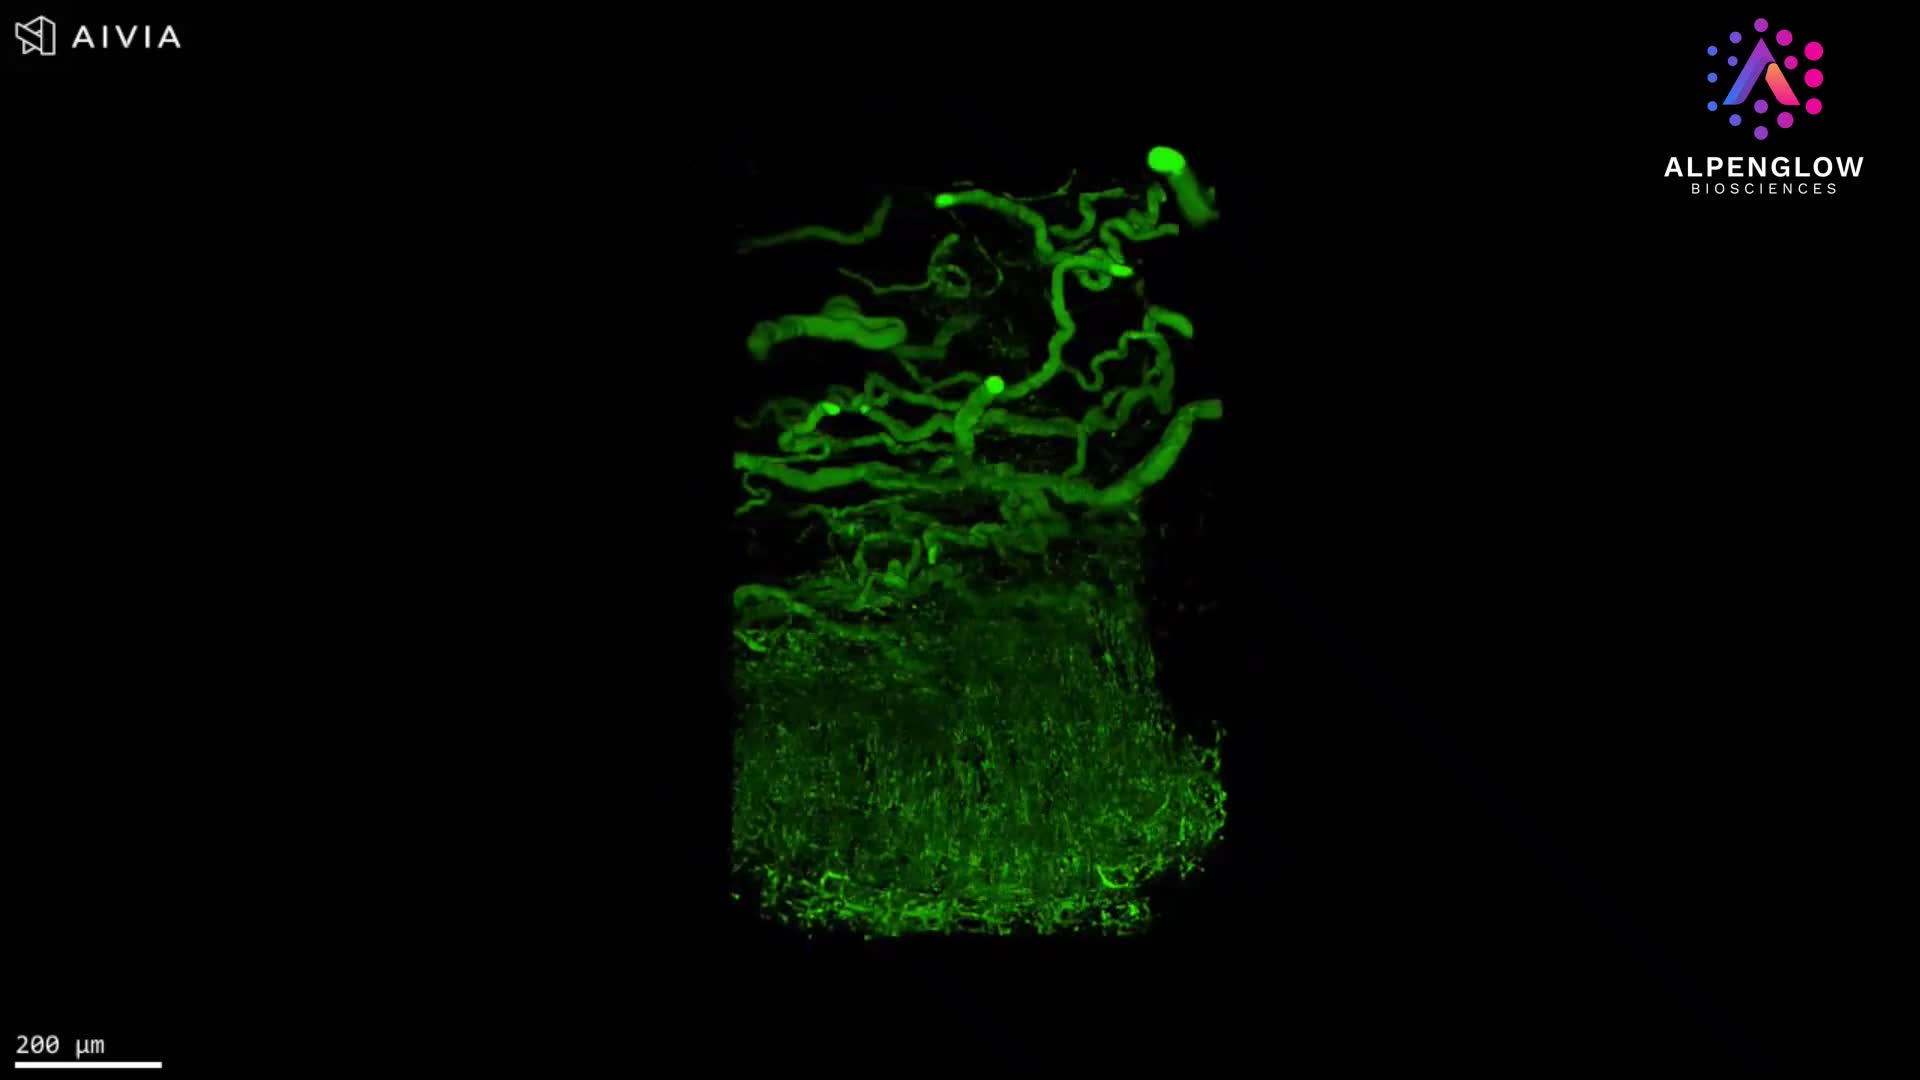
3D imaging of human colon tissue affected by Hirschsprung disease reveals hypertrophic submucosal nerve fibers and preserves enteric neural architecture across the tissue volume.
This dataset presents 3D imaging of human colon tissue affected by Hirschsprung disease, a congenital disorder characterized by the absence of enteric ganglion cells along a variable length of the bowel.
TO-PRO-3, shown in green, labels nuclei, while PGP9.5, shown in red, highlights enteric neural structures throughout the tissue volume.
The dataset reveals hypertrophic nerve fibers extending through the submucosa, with no ganglion cells visible within the imaged region. Preserving the tissue in 3D enables these neural structures to be followed across depth and provides continuous spatial context for their distribution and organization.
The dataset supports analysis of nerve fiber thickness, density, branching, orientation, and regional distribution, as well as assessment of enteric neural architecture across the imaged tissue volume. These measurements can support research into congenital gastrointestinal disorders and disease-associated changes in the enteric nervous system.
The tissue was imaged using the Aurora 3D™ Spatial Biology Solution, including the 3Di™ Hybrid Open-Top Light-Sheet microscope.
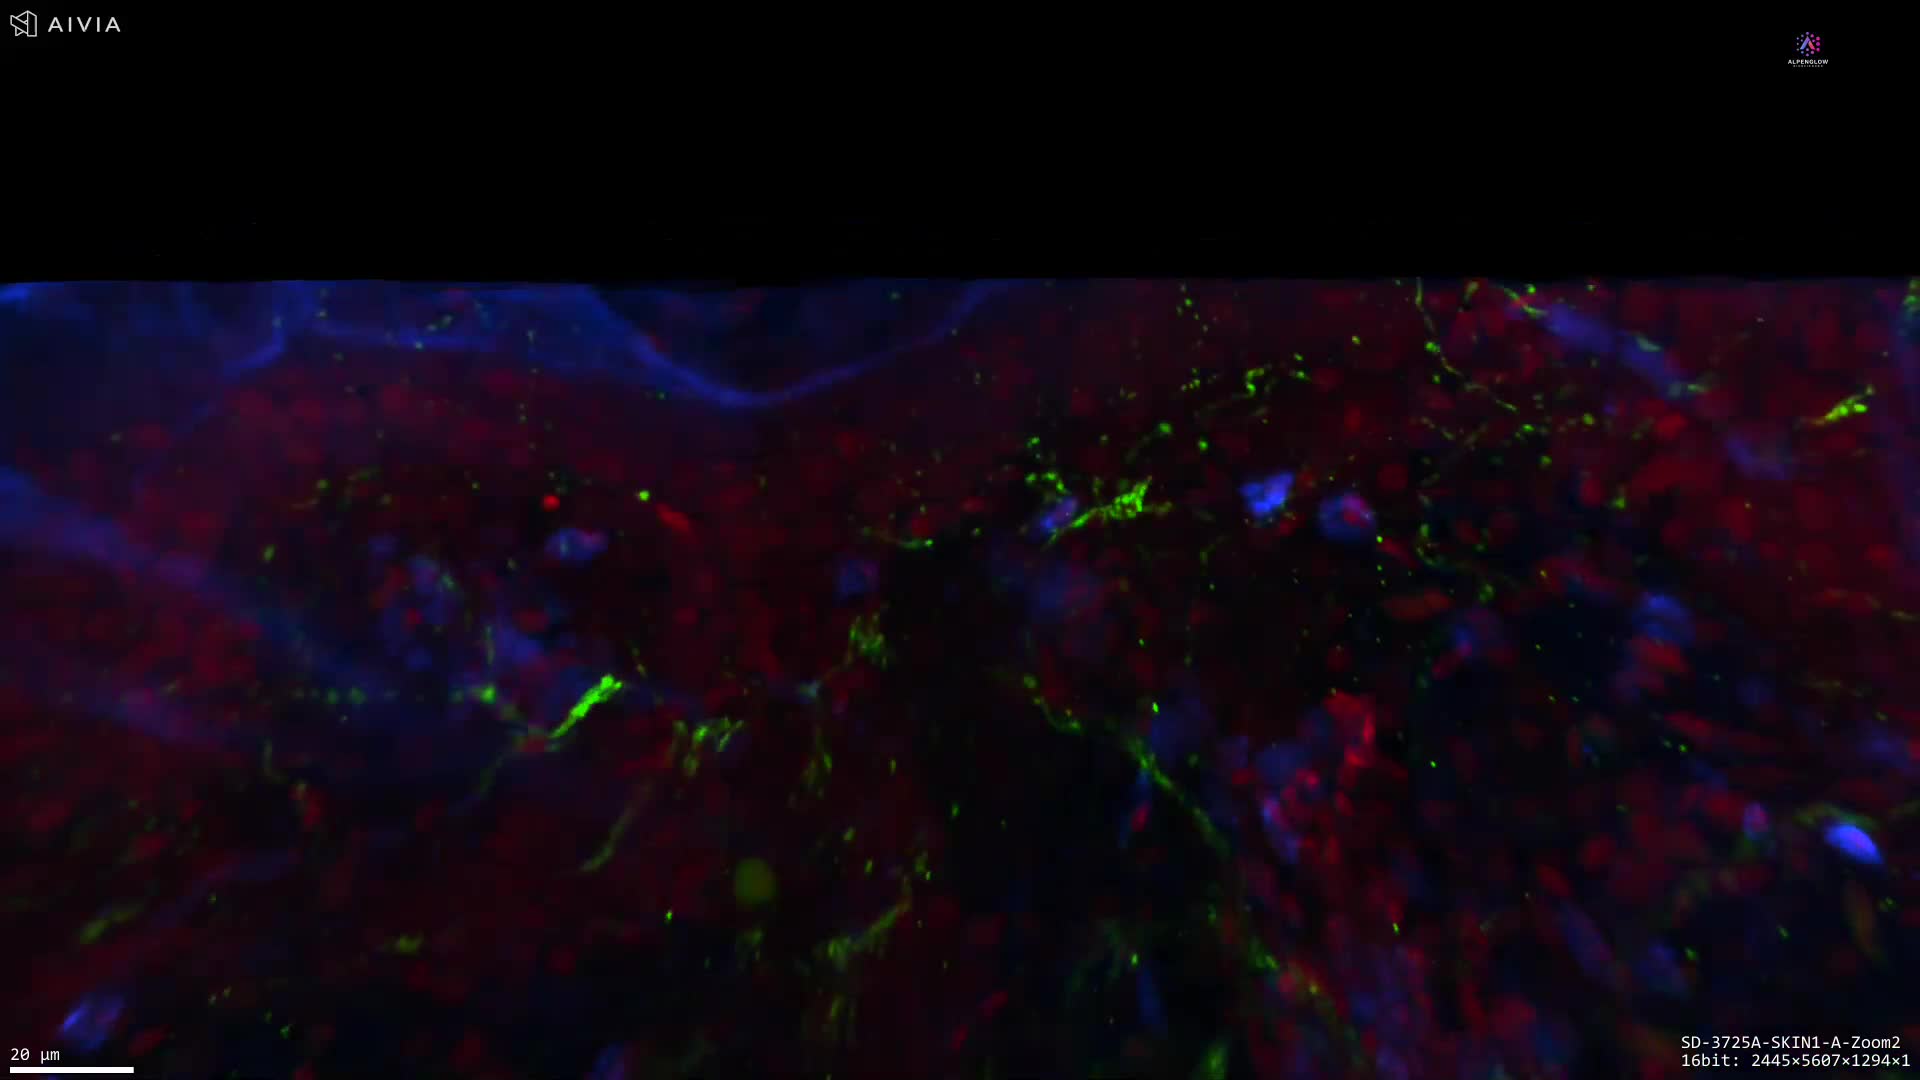
High-resolution 3D imaging of human skin preserves hair follicle, glandular, and neural architecture across depth, supporting spatial and quantitative analysis for hair and dermatology research.
This high-resolution 3D dataset presents human skin tissue, preserving the architecture of a hair follicle, its associated gland, and the surrounding nerve network across depth.
The volumetric view allows the follicle and glandular structure to be followed through the tissue, revealing their morphology, orientation, and spatial relationships with nearby nerve fibers. This continuous view reduces the fragmentation of complex structures that can occur across individual 2D tissue sections.
Following processing with 3Dm™ data management and analysis using 3Dai™ AI-powered analysis, the dataset supports measurement of follicle dimensions, glandular morphology, nerve density, branching, and distances between neural and follicular structures. These readouts are relevant to research on alopecia, inflammatory skin conditions, hair biology, and treatment-associated changes in follicular architecture.
Explore how 3D tissue imaging supports dermatology research across skin architecture, innervation, immune organization, and spatial relationships.
The tissue was imaged using the Aurora 3D™ Spatial Biology Solution, including the 3Di™ Hybrid Open-Top Light-Sheet microscope.
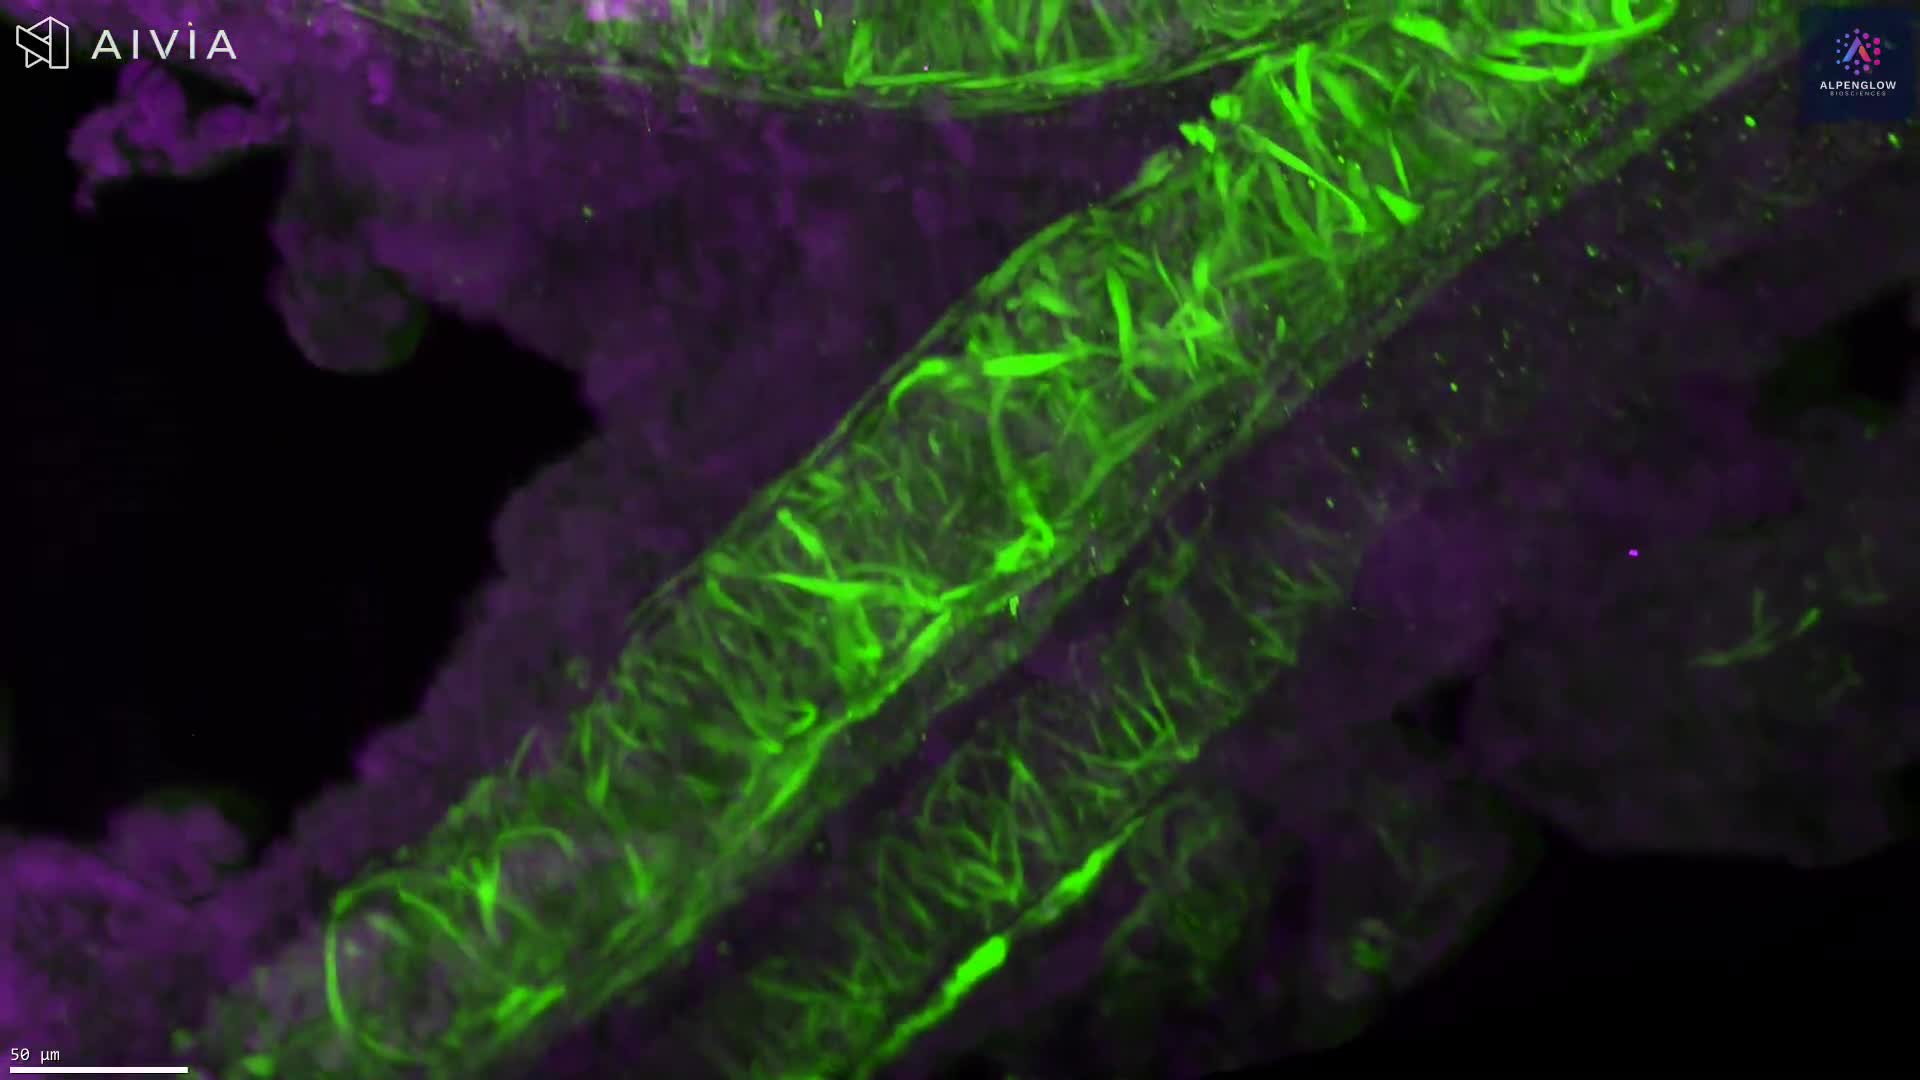
3D imaging of human placental tissue preserves vascular architecture and cellular organization across depth, supporting spatial and quantitative analysis of vessel-associated structures.
This 3D dataset presents human placental tissue, preserving vessel-associated structures and cellular organization across the imaged volume.
Alpha-smooth muscle actin, shown in green, highlights smooth muscle actin-positive cells associated with placental vessels. TO-PRO-3, shown in magenta, labels nuclei and provides cellular context throughout the tissue.
The volumetric view reveals vessel trajectories, branching, diameter variation, and the organization of smooth muscle actin-positive cells around larger vascular structures. Preserving these features across depth provides spatial context that can be fragmented across individual tissue sections.
The dataset supports quantitative analysis of vessel-associated structure density, branching, diameter, tortuosity, and regional variation across the placental tissue volume. These measurements are relevant to research on placental vascular development, remodeling, and maternal-fetal biology.
The tissue was imaged using the Aurora 3D™ Spatial Biology Solution, including the 3Di™ Hybrid Open-Top Light-Sheet microscope.
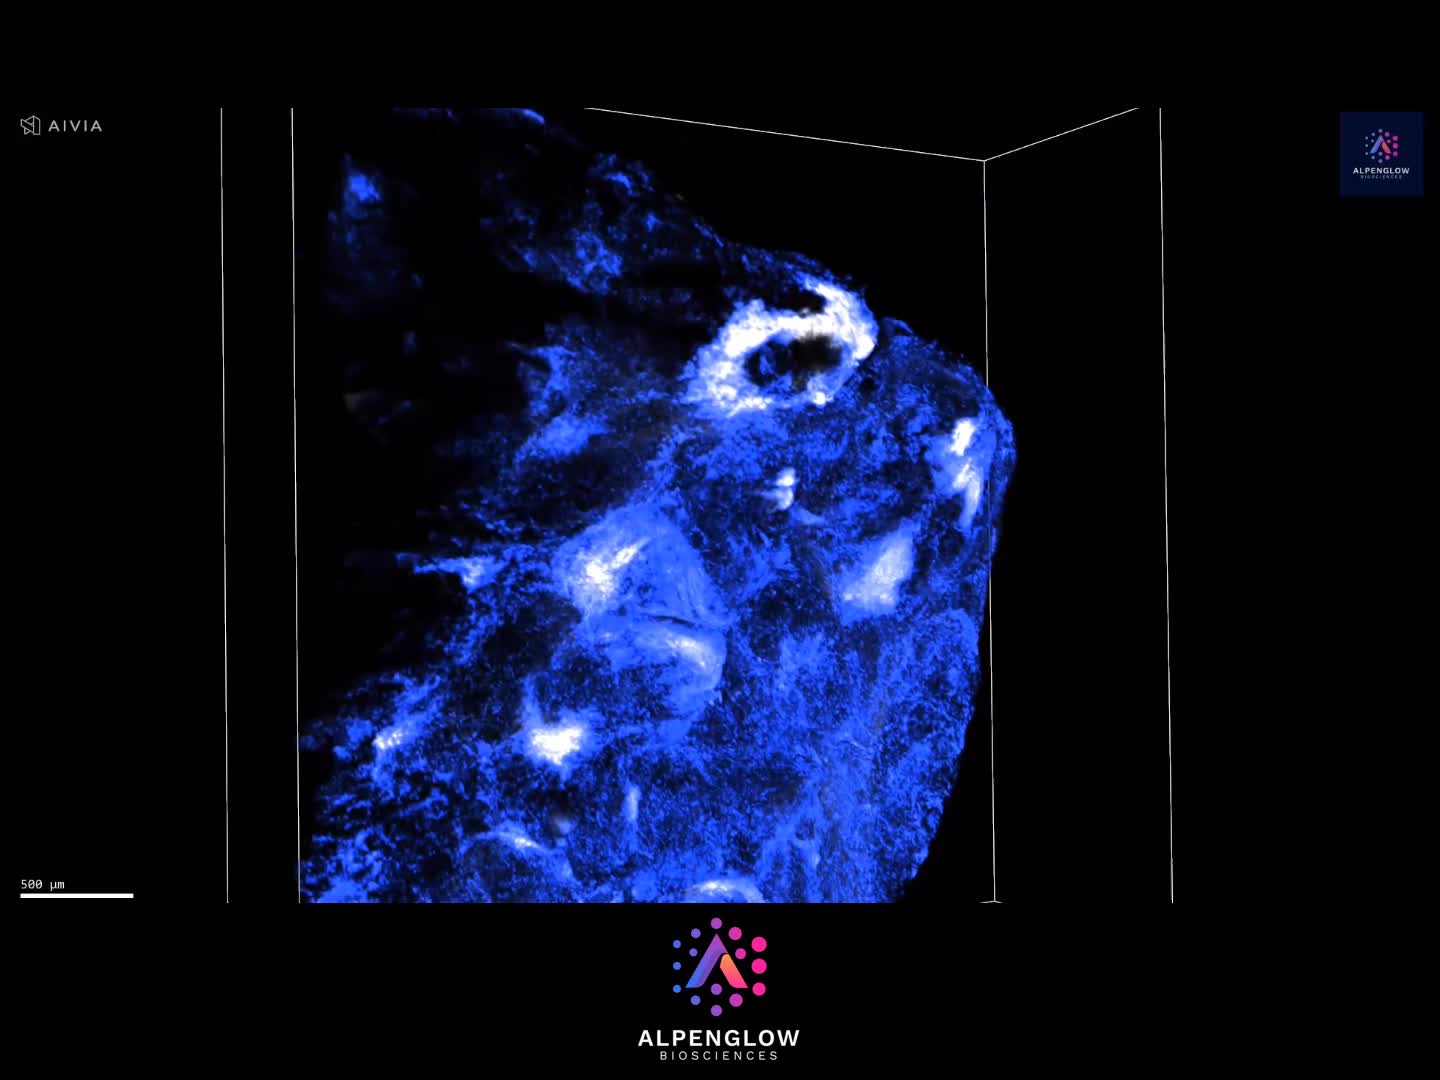
Scout-to-Zoom 3D computational H&E imaging identifies and quantifies tertiary lymphoid structures within an NSCLC tissue volume, preserving their morphology, depth, and surrounding tumor context.
This dataset presents 3D computational H&E imaging of tertiary lymphoid structures in a human non-small cell lung cancer sample.
TO-PRO-3 labels nuclei, while eosin highlights protein-rich tissue architecture. Together, the fluorescent signals are computationally rendered to create an H&E-like view of the intact tissue volume.
The Scout-to-Zoom workflow begins with rapid volumetric imaging at 2 µm per pixel to identify nuclear aggregates and other regions of interest across the tissue. Selected regions are then acquired at high resolution at 0.167 µm per pixel, revealing cellular morphology and TLS organization in greater detail.
In this NSCLC sample, Scout imaging identified dense nuclear aggregates that were examined using Zoom imaging and classified as two distinct tertiary lymphoid structures approximately 200 µm below the tissue surface. Their volumes and surface areas were quantified in 3D.
The dataset supports measurement of TLS number, volume, surface area, cellular density, distribution, and spatial relationships with surrounding tumor and stromal regions. Preserving each structure across depth reduces the sampling and orientation effects associated with individual 2D sections.
Explore how 3D tissue imaging supports immuno-oncology research across tumor architecture, immune-cell organization, and spatial relationships.
The tissue was imaged using the Aurora 3D™ Spatial Biology Solution, including the 3Di™ Hybrid Open-Top Light-Sheet microscope.

Computational H&E staining combined with non-destructive 3D imaging reveals the true complexity of tertiary lymphoid structures (TLS) in NSCLC. Unlike thin 2D sections that risk misclassification, Alpenglow’s 3Di platform captures entire TLS morphology, volume, and cellular composition, delivering accurate insights into immune architecture and tumor context.
Tertiary lymphoid structures (TLS) are critical immune aggregates that influence prognosis and response to immunotherapy in non-small cell lung cancer (NSCLC). Traditional single cross-section imaging often misrepresents TLS size, cellular composition, and maturity classification due to sampling bias.
Using Alpenglow’s 3Di spatial imaging platform and computational H&E staining, TLS can be visualized and quantified across entire tumor biopsies in 3D, non-destructively.
Computational H&E staining replicates the contrast of standard histology while preserving the intact tissue. In this NSCLC study, samples were stained with:
TO-PRO-3: nuclear marker for hematoxylin contrast
Eosin to highlight cytoplasm and extracellular matrix
After staining, the tissues were optically cleared and imaged at whole-block scale using Scout mode, followed by imaging at subcellular resolution in Zoom mode. This workflow maintains architectural context while enabling single-cell segmentation in 3D.
Key advantages:
Accurate detection and measurement of TLS in whole tissue samples
3D quantification of TLS volume, surface area, and cellular density
Improved classification of TLS maturity and organization
Enhanced biological insight through visualization of spatial context with surrounding tumor, stroma, and vasculature
In one NSCLC sample, what appeared as a single TLS in 2D was revealed in 3D to be two distinct structures with unique volumes and surface areas. Such insights demonstrate the power of combining computational H&E with 3D imaging to reveal structures invisible to conventional pathology.
By moving beyond 2D, researchers gain a more accurate and comprehensive understanding of TLS in oncology samples—opening new opportunities for translational research, biomarker development, and therapeutic discovery.
Read the TLS white paper.
3D segmentation of prostate glands using synthetic CK8 immunofluorescence derived from fluorescent H&E analogues. By combining image-translation models with traditional computer-vision methods, researchers achieved whole-biopsy 3D gland segmentation without manual labeling.
This study demonstrates annotation-free 3D segmentation of prostate glands using fluorescence-based microscopy and AI. A prostate specimen stained with a fluorescent analogue of H&E was converted into a synthetic CK8 immunofluorescence dataset via an image-sequence translation model trained on paired H&E analogue and real CK8 datasets. Traditional computer-vision algorithms were then applied to the synthetic CK8 images for segmentation of gland epithelium, lumen, and stromal regions. The synthetic CK8 image blocks were mosaicked to reconstruct a 3D CK8 dataset of the entire biopsy, enabling accurate gland segmentation. Gland lumen spaces were further segmented by filling regions enclosed by epithelia, with refinements from the cytoplasm (eosin) channel.
3D images acquired with the Aurora™ 3Di Hybrid Open Top Light Sheet (HOTLS) microscope.
With integration of 3Dm data management and 3Dai AI-powered segmentation, researchers can perform reproducible, high-content quantification. This 3D approach eliminates slice bias and ensures accurate analysis at scale.
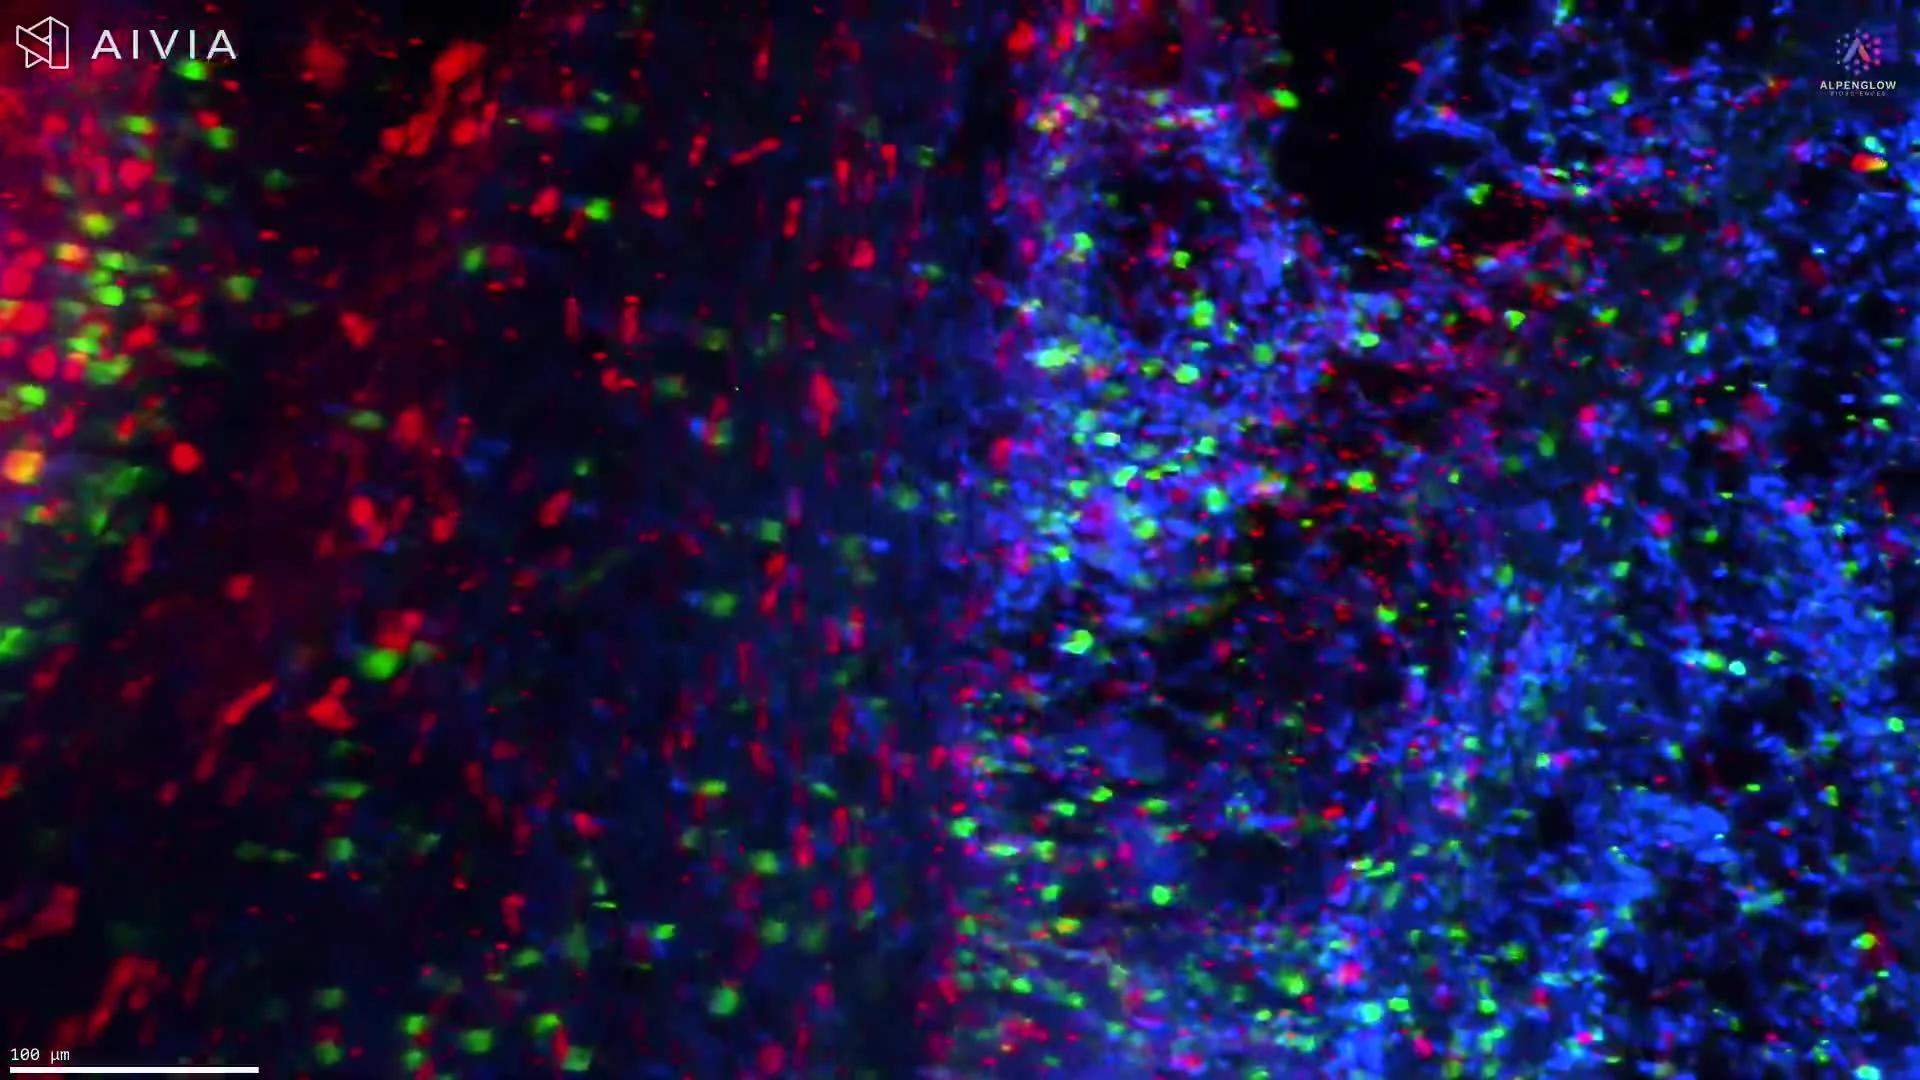
3D imaging of melanoma tissue with CD45, Neutrophil Elastase, and TO-PRO-3 reveals hidden immune–tumor interactions and sets a new standard for research.
Through advanced staining and high-resolution 3D imaging, we move beyond the limitations of flat, 2D slides to capture the full spatial context of human melanoma tissue.
In this video, you can observe:
🟢 CD45 – highlighting immune cells
🔴 Neutrophil Elastase – marking neutrophils
🔵 TO-PRO-3 – illuminating nuclei
Each marker reveals cellular architecture with striking clarity, uncovering complex immune–tumor interactions previously hidden in 2D views.
This depth of visualization enhances our understanding of melanoma biology and establishes a new benchmark for research.
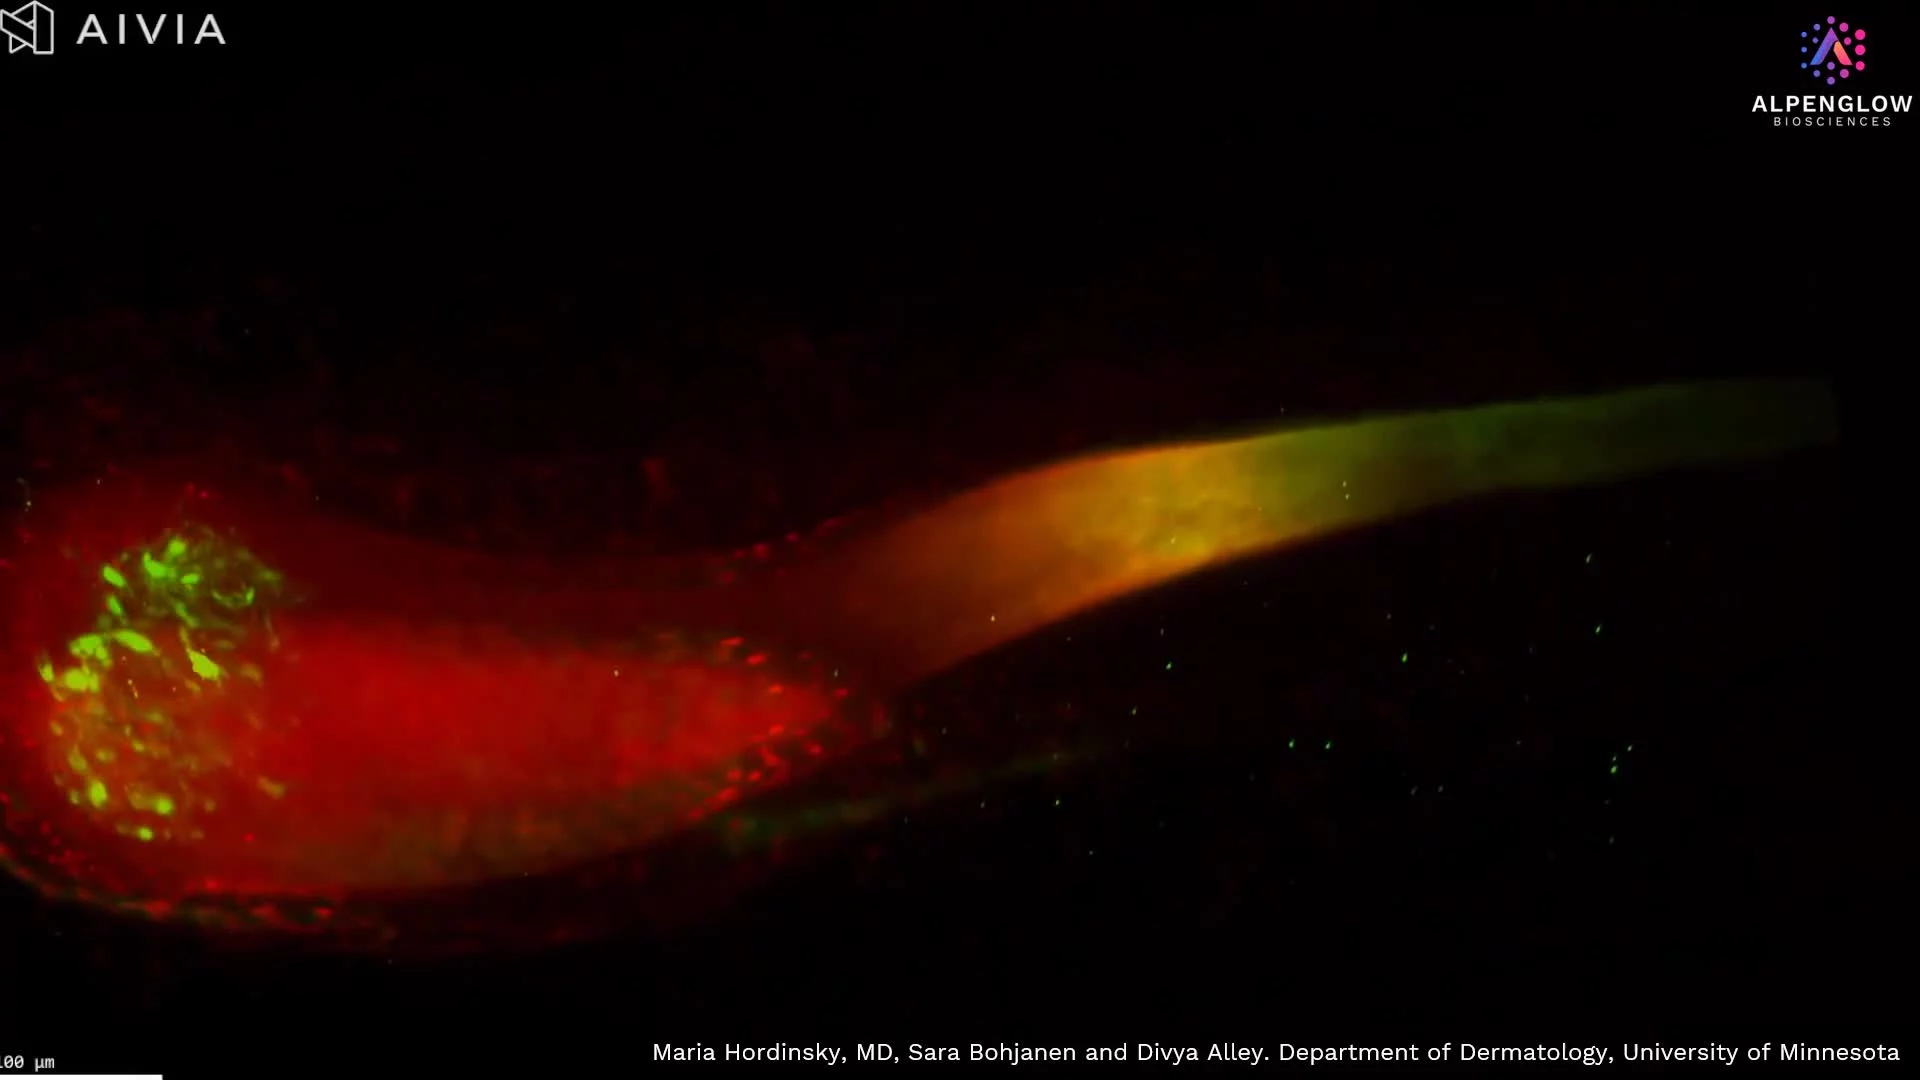
See an entire hair follicles in true 3D, from bulb to dermal papilla, with detailed mapping of sensory nerves and nuclei for alopecia and hair research.High-resolution 3D imaging of scalp tissue reveals nuclei, immune cells, and nerve networks, driving new insights into alopecia and other skin diseases.
For the first time, a hair follicle can be visualized in its true three-dimensional architecture, from the bulb where growth begins to the dermal papilla, a key signaling center for follicle development. This high-resolution dataset, captured with the Aurora platform and HOTLS microscopy, also reveals the hair plexus, a dense network of sensory nerve fibers critical for touch sensation.
Stains used:
PGP9.5 (Green): Sensory nerve fibers surrounding the follicle
TO-PRO-3 (Red): Cell nuclei distribution
Through advanced 3D fluorescence imaging, combined with data management and AI-powered segmentation, subtle structural changes in the follicle can be detected earlier than with conventional 2D histology. This capability is transforming alopecia research, providing a new window into hair biology, disease mechanisms, and treatment response.
By integrating quantifiable 3D tissue imaging with digital pathology and spatial profiling, researchers gain unprecedented insights into hair follicle biology and inflammatory skin conditions. This breakthrough demonstrates how better imaging leads directly to better insights, and ultimately better treatments.
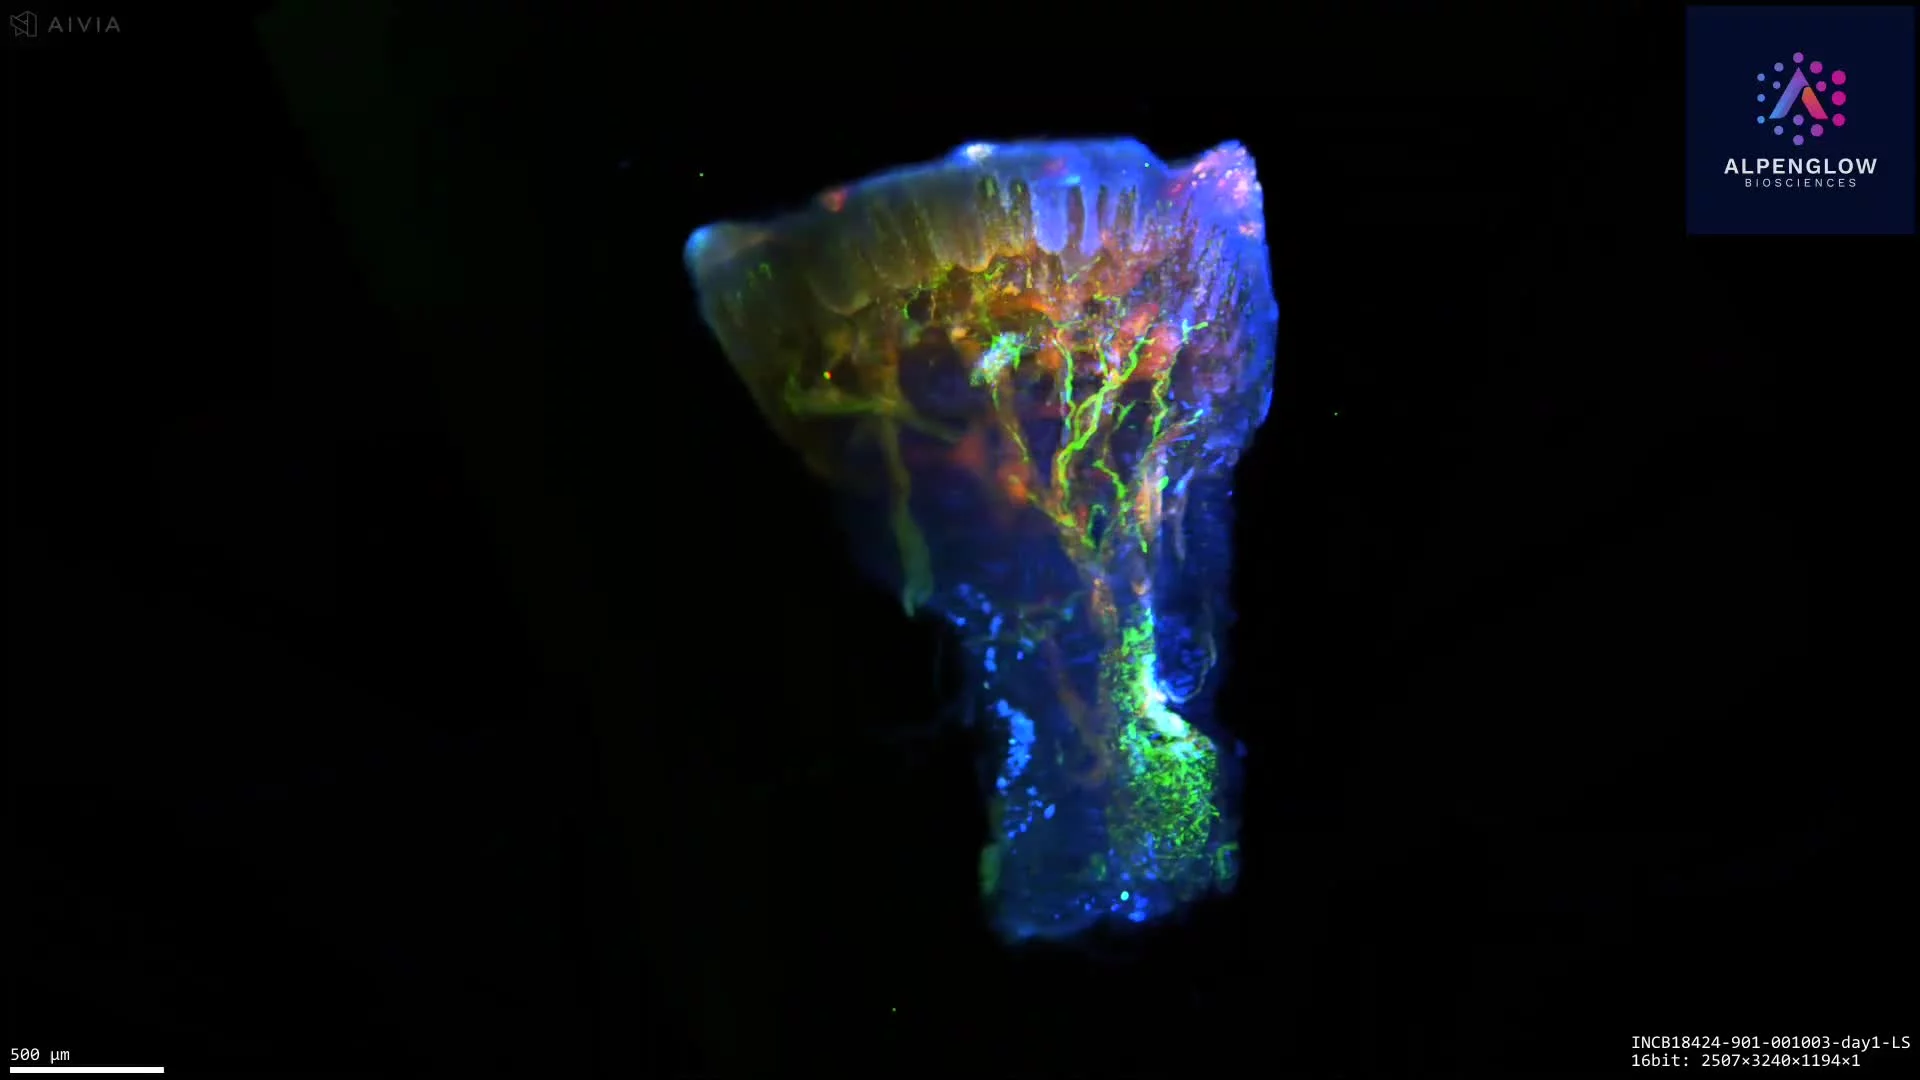
3D imaging of atopic dermatitis skin punch biopsy; the tissue is stained with TO-PRO-3, PGP9.5, and CD45. Explore detailed innervation and immune-cell interactions in lesional skin.
Low-resolution 3D imaging with Hybrid Open Top Light Sheet (HOTLS) microscopy of an entire lesional Atopic Dermatitis skin punch biopsy highlights epidermal and dermal innervation.
The tissue was stained with TO-PRO-3 (red, nuclei), PGP9.5 (green, nerves), and CD45 (blue, T cells), enabling comprehensive visualization of neuro-immune interactions and inflammatory changes across the full biopsy.
See our AD use case.
Image reproduced with permission from Incyte Corporation.
From vasculature to single cells, 3D light-sheet imaging reveals the intricate architecture of a whole mouse brain in unparalleled detail.
This dataset showcases 3D light-sheet imaging of a whole mouse brain, captured with the Aurora™ 3Di Hybrid Open Top Light Sheet (HOTLS) microscope. From organ-level vasculature down to single-cell resolution, the imaging reveals the full intricacy of brain architecture across every layer.
The dataset highlights how volumetric imaging preserves intact morphology, making it possible to study neuronal networks, vascular pathways, and cellular organization without the distortions of traditional 2D histology.
Complete visualization of neuronal and vascular networks across the brain
Cellular context preserved in full volumetric detail
Accurate mapping of tissue complexity that 2D slices cannot replicate
This dataset connects directly to the Nature Methods paper presenting our light-sheet microscope: Read the paper.
By combining 3Dm data management with 3Dai AI-powered segmentation, researchers can extend these visuals into actionable analyses, from neuronal density measurements to vascular branching and spatial profiling.
Applications include neuroscience research, brain mapping, and studies of neurodegenerative diseases, where understanding tissue complexity in situ is critical.
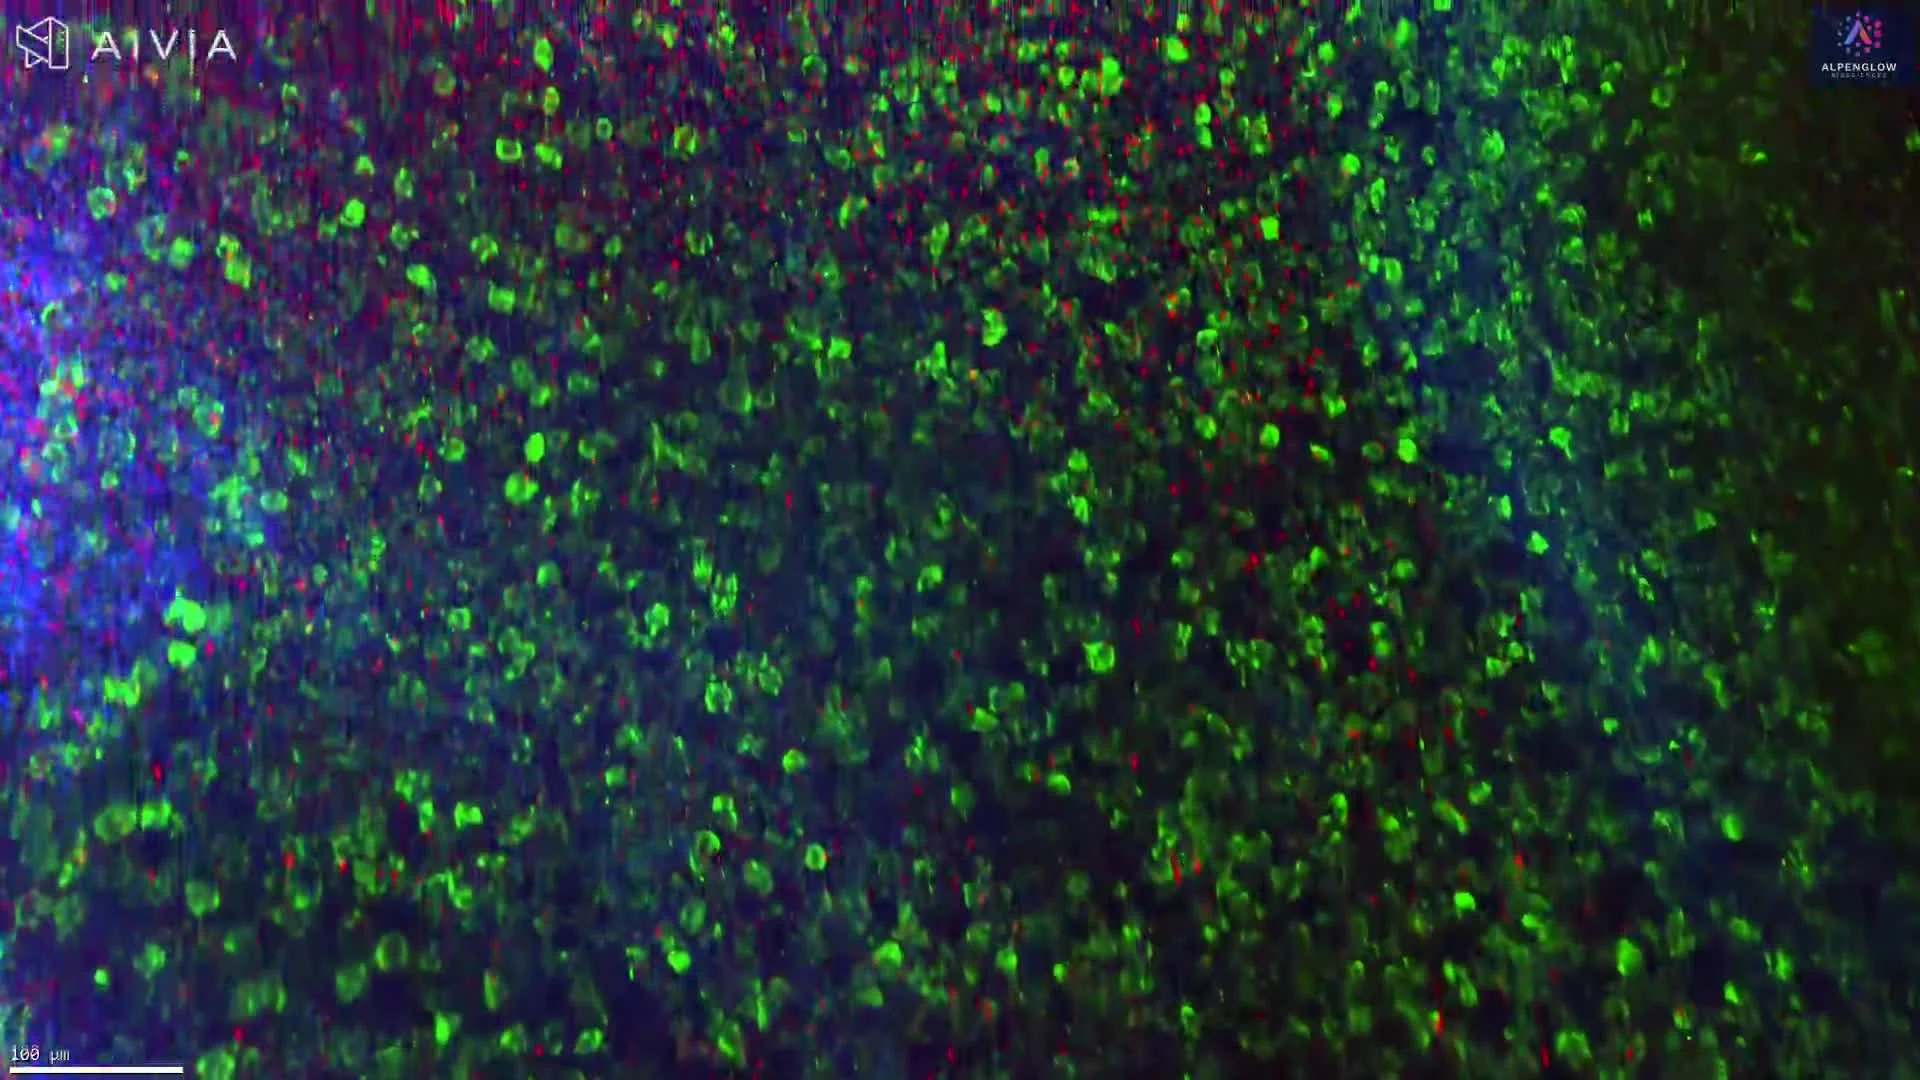
3D imaging of mouse colorectal tumor stained with CD3, B220, and YoPro1 reveals tertiary lymphoid structures (TLS) in full spatial context.
This dataset showcases a 3D visualization of a mouse colorectal tumor, imaged on the Aurora™ 3Di Hybrid Open Top Light Sheet (HOTLS) microscope to reveal key immune populations in their native spatial context.
Stains used:
CD3 (Purple): Labels T cells
B220 (Green): Marks B cells
YoPro1 (Blue): Highlights nuclei
Within the tumor microenvironment, two tertiary lymphoid structures (TLS) are clearly visible, their complex organization preserved in full volumetric detail. TLS are dynamic, three-dimensional immune aggregates that are often overlooked in thin-section histology.
By combining light-sheet imaging with 3Dm data management and 3Dai AI-powered segmentation, the full tumor volume was imaged without slicing, enabling TLS segmentation, quantification, and spatial profiling. Researchers can measure TLS size, density, immune cell composition, and their relationships to tumor structures with unprecedented accuracy.
This dataset highlights how 3D histology, digital pathology, and spatial profiling uncover critical immune features, delivering insights essential for immuno-oncology research and advancing biomarker discovery.
Discover more in our TLS White Paper.
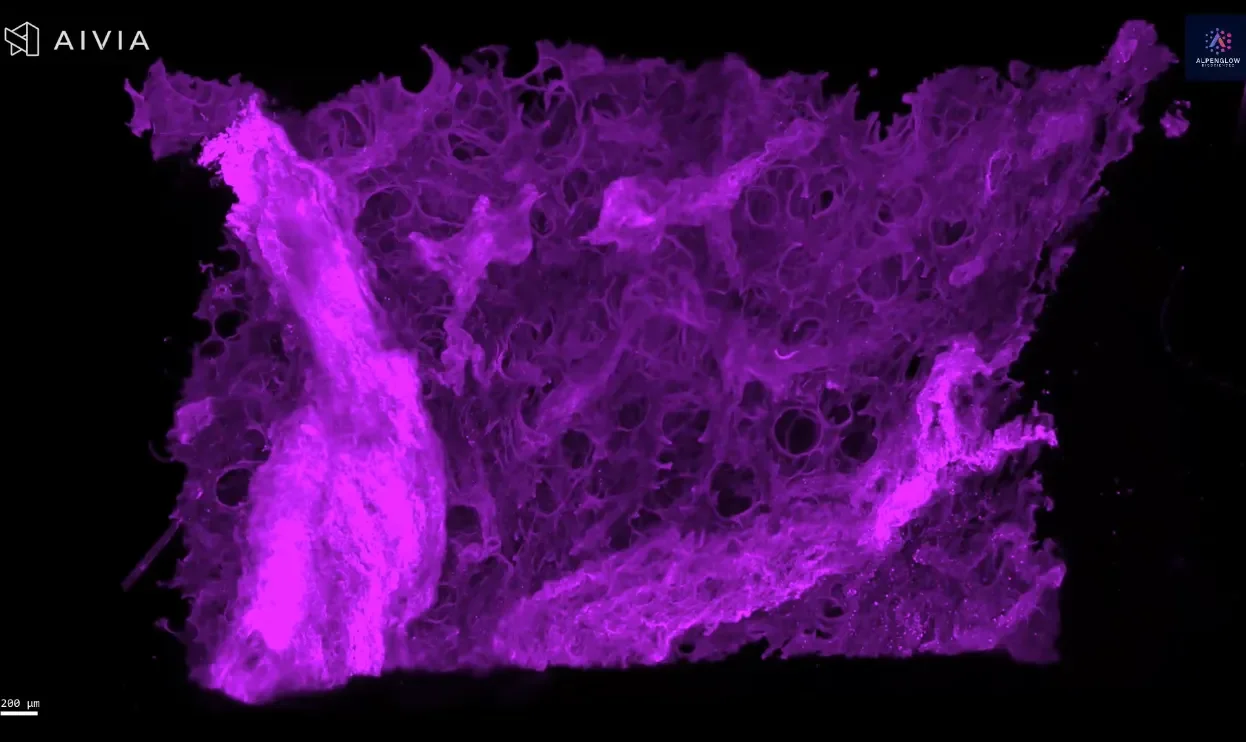
3D fluorescence imaging of human lung tissue stained with Fast Green reveals collagen architecture for fibrosis and tissue remodeling research.
This 3D dataset reveals the intricate extracellular matrix of the human lung, captured with the Aurora™ 3Di Hybrid Open Top Light Sheet (HOTLS) microscope on Alpenglow’s 3D digital pathology platform. Collagen is stained with Fast Green and rendered in vivid detail, exposing the structural complexity and functional organization of lung tissue.
Unlike conventional 2D histology, this workflow images thick, intact tissue with no slicing or sectioning. The result is a distortion-free, spatially preserved view of the lung microenvironment, enabling accurate analysis of tissue architecture in its native state.
Through integration with 3Dm data management and 3Dai AI-powered segmentation, collagen orientation, density, and organization can be quantified across the tissue volume. These insights provide a deeper understanding of how collagen remodeling drives fibrosis, structural changes in tissue remodeling, and disease progression.
This dataset demonstrates the power of 3D histology and spatial profiling in lung research and translational studies.
Tissue provided by AnaBios.
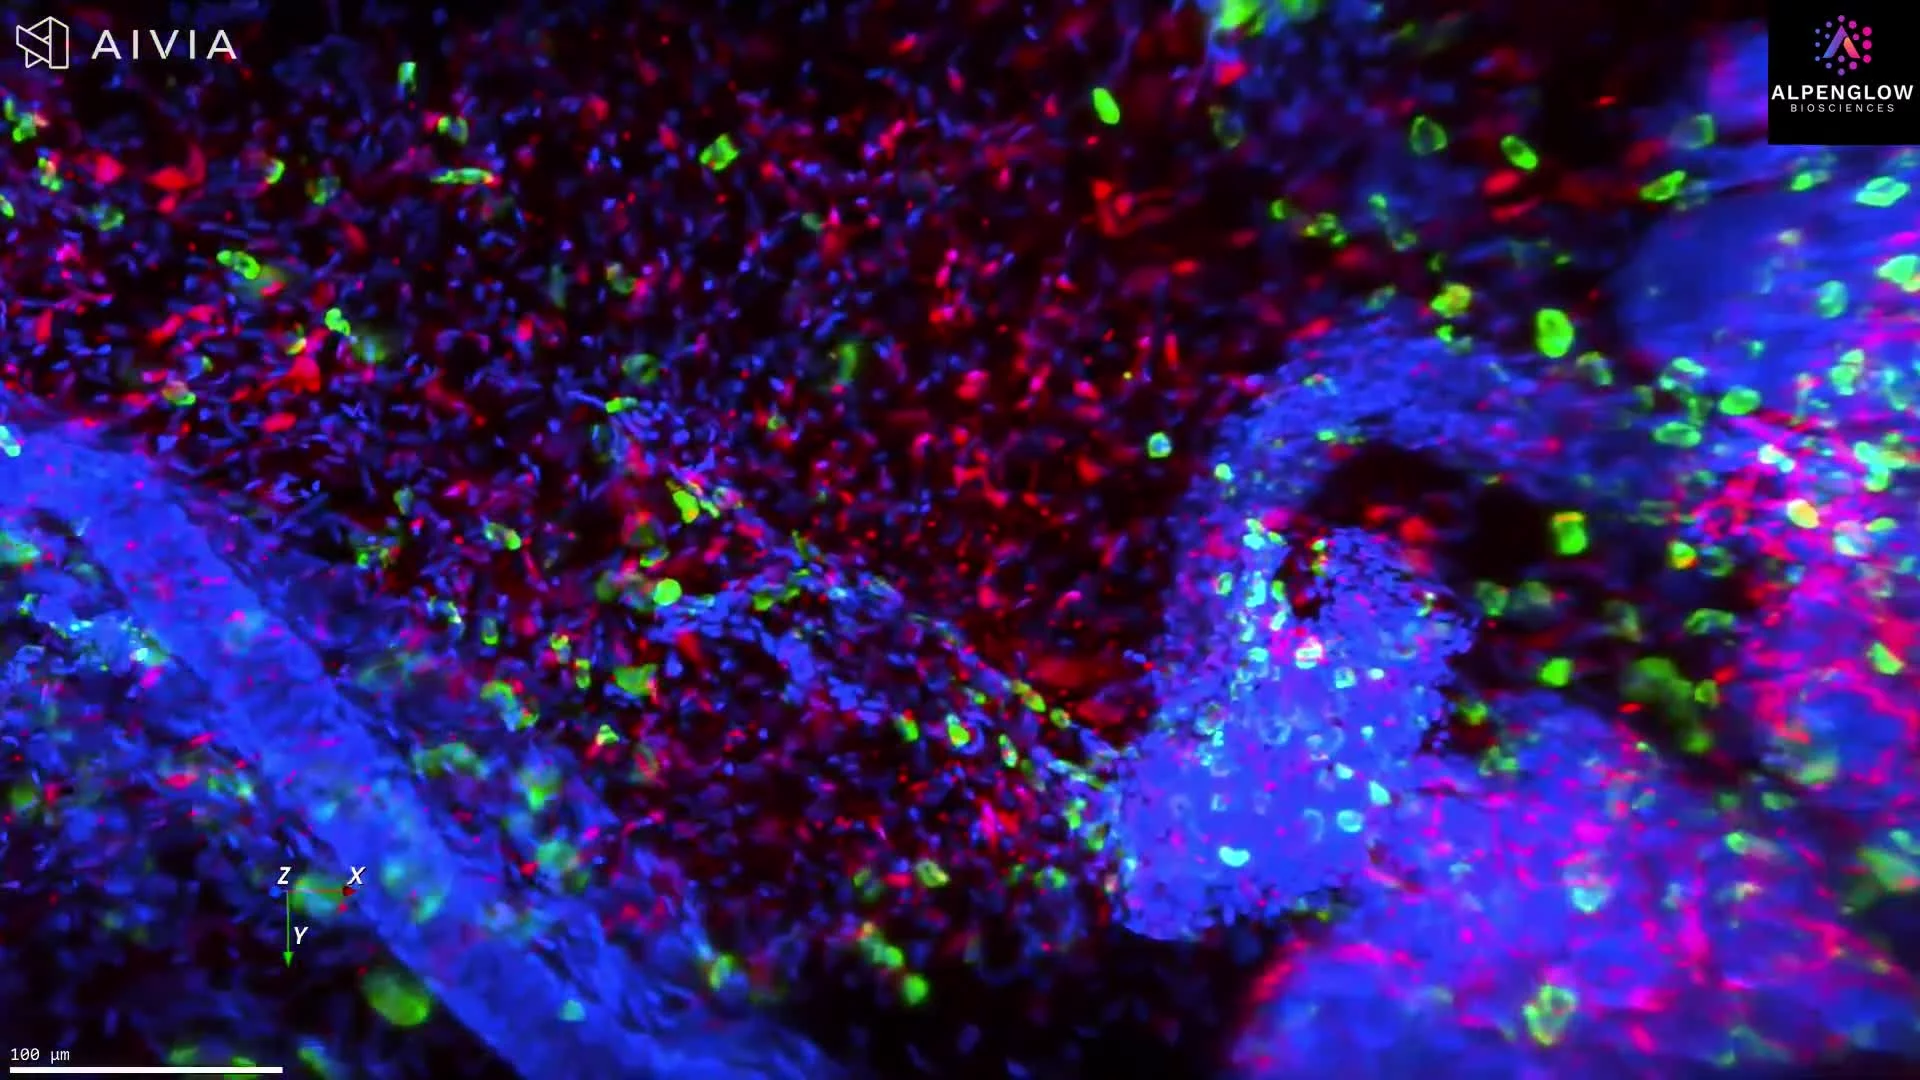
3D imaging of human skin biopsy stained with tryptase, TO-PRO-3, and PGP9.5 reveals mast cell–nerve interactions for dermatology and oncology research.
This dataset presents an intact, fluorescence-labeled human skin biopsy imaged in true 3D with the Aurora™ 3Di Hybrid Open Top Light Sheet (HOTLS) microscope. The volumetric view reveals the native architecture of neuroimmune interactions that conventional 2D slices cannot capture.
Stains used:
Tryptase (Green): Labels mast cells
TO-PRO-3 (Blue): Marks nuclei
PGP9.5 (Red): Traces nerves
By preserving full cell morphology and spatial relationships, this dataset provides the ground truth for quantifying mast cell density, mapping nerve proximity, and investigating mechanisms underlying chronic itch, fibrosis, and inflammatory skin disorders.
With integration of 3Dm data management and 3Dai AI-powered segmentation, researchers can perform reproducible, high-content quantification of neuroimmune interactions. This 3D approach eliminates slice bias and ensures accurate analysis at scale.
Applications span translational dermatology, where mast cells play a role in inflammatory skin disease, and immuno-oncology, where mast cell–nerve dynamics may influence tumor microenvironments. This example illustrates how 3D histology and digital pathology offer actionable insights that extend beyond visualization to measurable data.
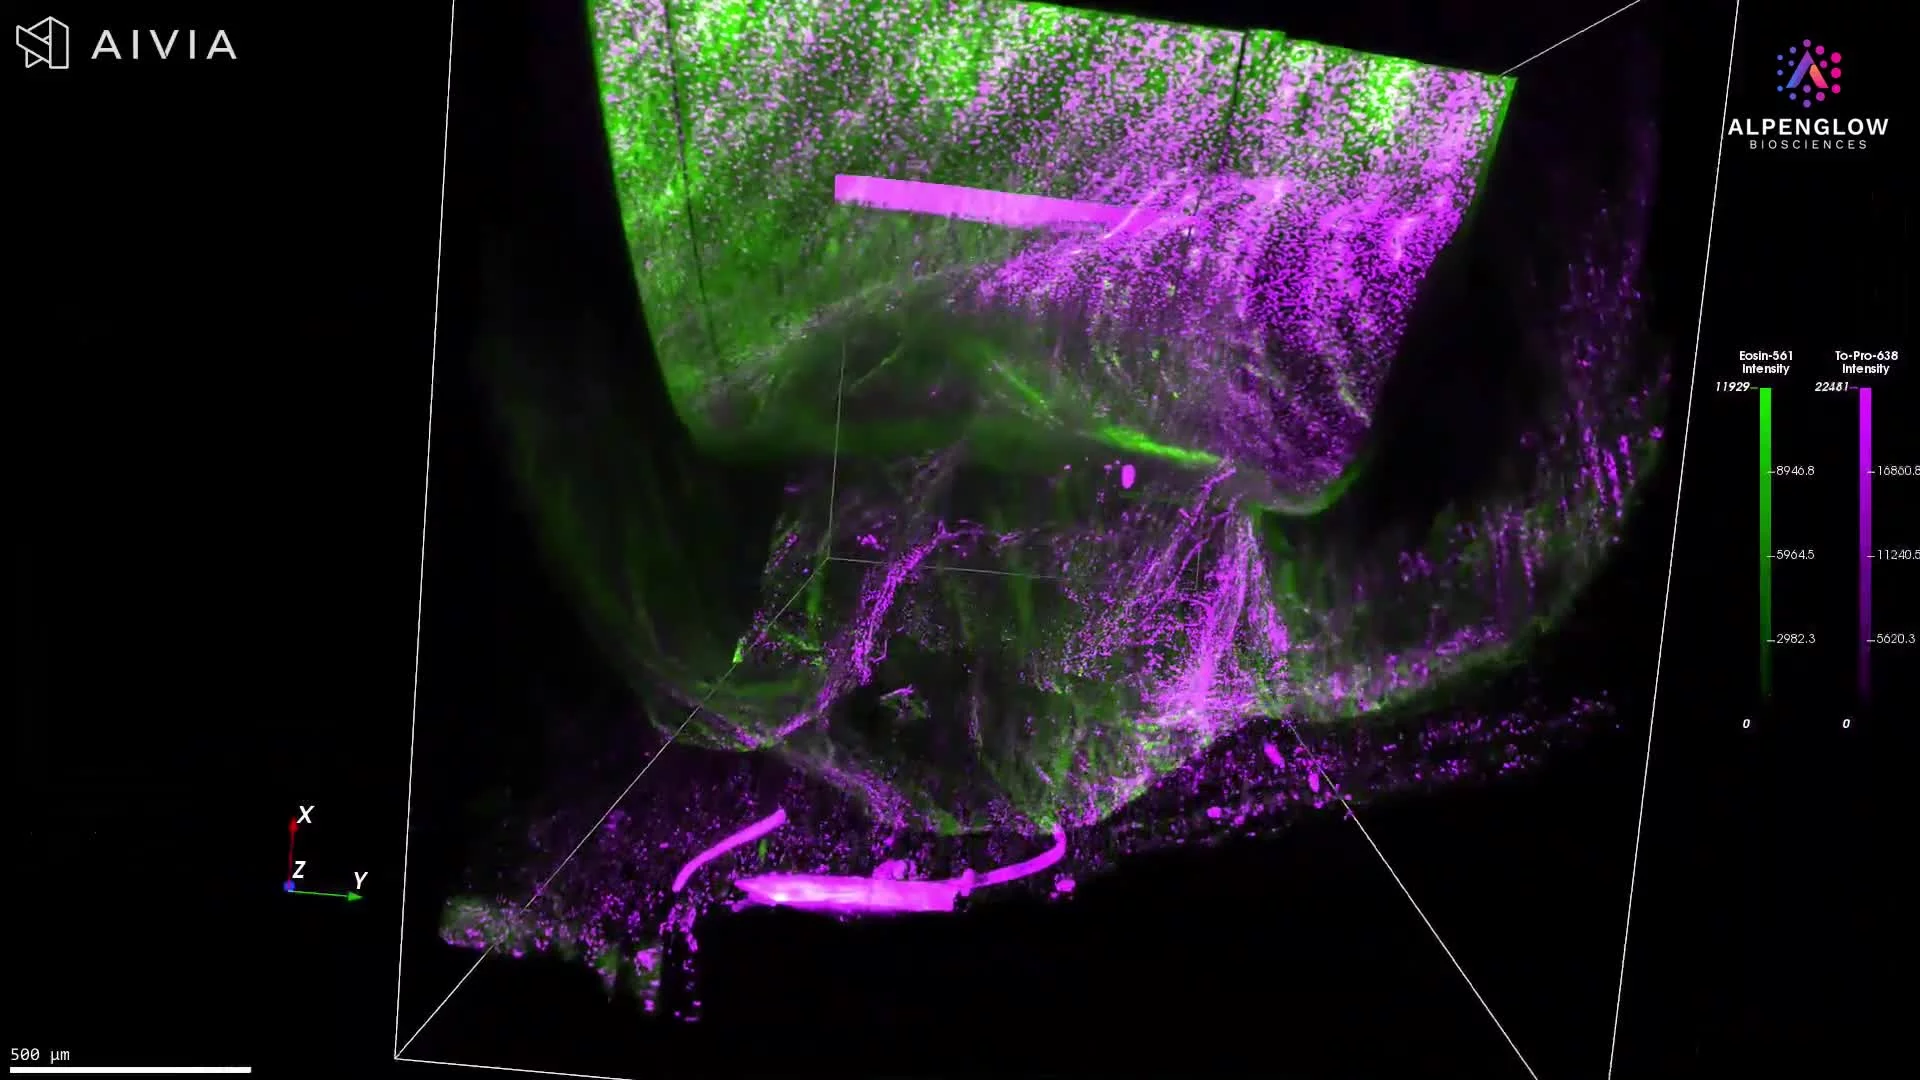
High-resolution 3D imaging of a cleared rabbit retina stained with TO-PRO-3 and eosin, preserving architecture across retinal, choroid, and scleral layers.
This dataset presents a high-resolution 3D visualization of a cleared rabbit retina, captured intact on the Aurora™ 3Di Hybrid Open Top Light Sheet (HOTLS) microscope. By avoiding physical sectioning, the imaging preserves the true spatial architecture of the tissue.
Stains used:
TO-PRO-3 (Magenta, pseudocolor): Labels nuclei
Eosin (Green, pseudocolor): Highlights cytoplasmic structures
The fly-through reveals the full thickness of the sample (≈1 × 1 × 4 mm), capturing the retina, choroid, and sclera in their native spatial organization. This volumetric dataset enables accurate morphological and contextual analysis at cellular resolution, overcoming the limitations of 2D histology.
When combined with 3Dm data management and 3Dai AI-powered segmentation, the dataset can be further analyzed for nuclear density, layer-specific organization, and cellular distribution. Applications include ophthalmology research, retinal disease modeling, and translational studies focused on vision science.
Next step
Bring your translational question into 3D
Share your tissue type, marker strategy, study stage, and intended readouts. Alpenglow can help evaluate where intact 3D tissue imaging, spatial profiling, and quantitative analysis fit your translational workflow.
The Aurora 3D™ workflow connects 3Di™ , 3Dm™ , and 3Dai™ across imaging, data management, and AI-powered analysis.
Discuss your study
Tell the Alpenglow team what you need to visualize, measure, or compare across intact tissue.

Computational H&E staining combined with non-destructive 3D imaging reveals the true complexity of tertiary lymphoid structures (TLS) in NSCLC. Unlike thin 2D sections that risk misclassification, Alpenglow’s 3Di platform captures entire TLS morphology, volume, and cellular composition, delivering accurate insights into immune architecture and tumor context.
Tertiary lymphoid structures (TLS) are critical immune aggregates that influence prognosis and response to immunotherapy in non-small cell lung cancer (NSCLC). Traditional single cross-section imaging often misrepresents TLS size, cellular composition, and maturity classification due to sampling bias.
Using Alpenglow’s 3Di spatial imaging platform and computational H&E staining, TLS can be visualized and quantified across entire tumor biopsies in 3D, non-destructively.
Computational H&E staining replicates the contrast of standard histology while preserving the intact tissue. In this NSCLC study, samples were stained with:
TO-PRO-3: nuclear marker for hematoxylin contrast
Eosin to highlight cytoplasm and extracellular matrix
After staining, the tissues were optically cleared and imaged at whole-block scale using Scout mode, followed by imaging at subcellular resolution in Zoom mode. This workflow maintains architectural context while enabling single-cell segmentation in 3D.
Key advantages:
Accurate detection and measurement of TLS in whole tissue samples
3D quantification of TLS volume, surface area, and cellular density
Improved classification of TLS maturity and organization
Enhanced biological insight through visualization of spatial context with surrounding tumor, stroma, and vasculature
In one NSCLC sample, what appeared as a single TLS in 2D was revealed in 3D to be two distinct structures with unique volumes and surface areas. Such insights demonstrate the power of combining computational H&E with 3D imaging to reveal structures invisible to conventional pathology.
By moving beyond 2D, researchers gain a more accurate and comprehensive understanding of TLS in oncology samples—opening new opportunities for translational research, biomarker development, and therapeutic discovery.
Read the TLS white paper.