
Immunology Researcher
Spatial immune readouts
Quantify how immune responses are organized in tissue
Move beyond isolated cell counts to examine immune distribution, cellular proximity, tissue compartments, and treatment-associated changes across the full sample volume.
Immune infiltration and localization
Map where immune cells accumulate, disperse, or remain absent across intact tumors, inflamed tissues, and anatomical compartments.
Cellular neighborhoods and proximity
Quantify distances and spatial relationships between immune cells, target cells, tumor regions, and surrounding tissue structures.
Immune exclusion and organized structures
Characterize compartmentalization, stromal boundaries, immune exclusion, cluster formation, and tertiary lymphoid structure organization in full 3D context.
Treatment-associated immune remodeling
Compare changes in immune density, distribution, clustering, and cellular relationships across treatment conditions or disease stages.
High-resolution 3D imaging of an intact mouse colorectal tumor reveals TLS-associated immune organization across tissue depth. B220-positive regions are shown in green, CD3-positive regions in magenta, and nuclei in blue.
This video presents high-resolution 3D imaging of an intact mouse colorectal tumor, revealing TLS-associated immune organization across the tissue volume.
B220, shown in green, highlights B-cell-rich regions. CD3, shown in magenta, identifies T-cell-rich regions, while nuclei are shown in blue to provide cellular and tissue context. Together, these markers reveal the spatial arrangement of B- and T-cell populations within organized immune aggregates.
The workflow begins with volumetric screening of the cleared tumor to identify regions containing dense B220 and CD3 signal. Selected regions are then imaged at higher resolution, preserving their position within the surrounding tumor while revealing cellular organization in greater detail.
With appropriate segmentation and validated TLS criteria, the dataset can support analysis of aggregate numbers, volume, distribution, cellular organization, and spatial relationships with surrounding tumor regions.
Explore how 3D tissue imaging supports immuno-oncology research across tumor architecture, immune-cell organization, and spatial relationships.
The tissue was imaged using the Aurora 3D™ Spatial Biology Solution, including the 3Di™ Hybrid Open-Top Light-Sheet microscope.
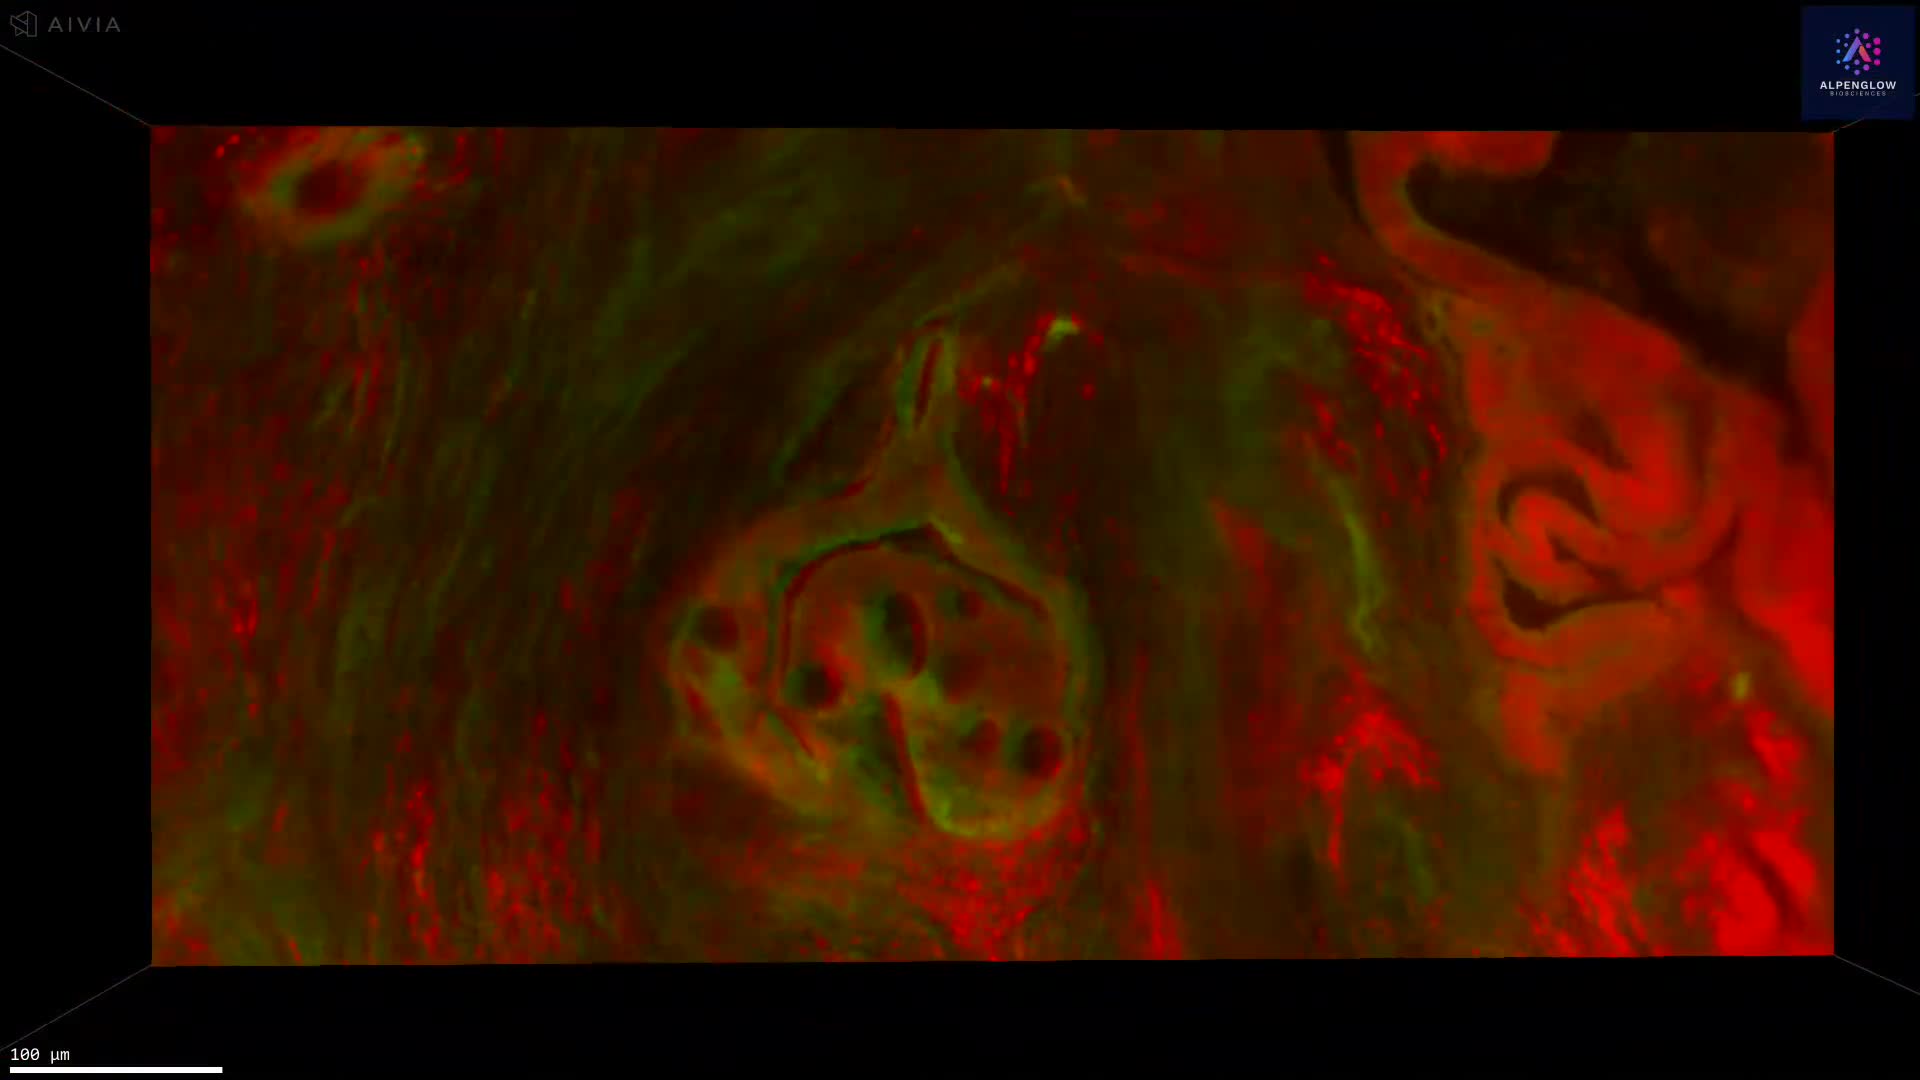
3D fluorescence imaging of human colorectal cancer FFPE tissue reveals spatial organization across depth that cannot be captured with single 2D histology sections.
This video demonstrates three-dimensional fluorescence imaging of human colorectal cancer (CRC) FFPE tissue, acquired using a volumetric workflow designed to preserve tissue architecture across depth.
As described in the linked CRC immune-exclusion study, intact CRC FFPE blocks are deparaffinized, fluorescently labeled, optically cleared, and imaged in three dimensions to avoid sampling bias inherent to conventional histology.
Large tissue volumes on the order of ~300 mm³ are first captured at 2 µm per pixel to retain full spatial context. From this dataset, a focused region of interest (~0.5 mm³) is selected and re-imaged at 0.33 µm per pixel, enabling high-resolution visualization of cellular and structural features within their native environment.
In this example, nuclei are labeled with TO-PRO-3, while eosin provides general protein contrast, allowing clear differentiation between tumor parenchyma and stromal compartments.
By traversing the full depth of the tissue, this volumetric view reveals spatial heterogeneity, compartmental organization, and boundary shifts that are not detectable in a single 2D section. As shown in the linked analysis, accurate characterization of stromal and parenchymal distributions in CRC can require dozens of 2D sections, whereas a single 3D dataset preserves this information inherently.
This example illustrates why 3D tissue imaging is critical for studying tumor microenvironments and immune phenotypes, and why volumetric data provide a more reliable foundation for quantitative spatial analysis than traditional slide-based workflows.
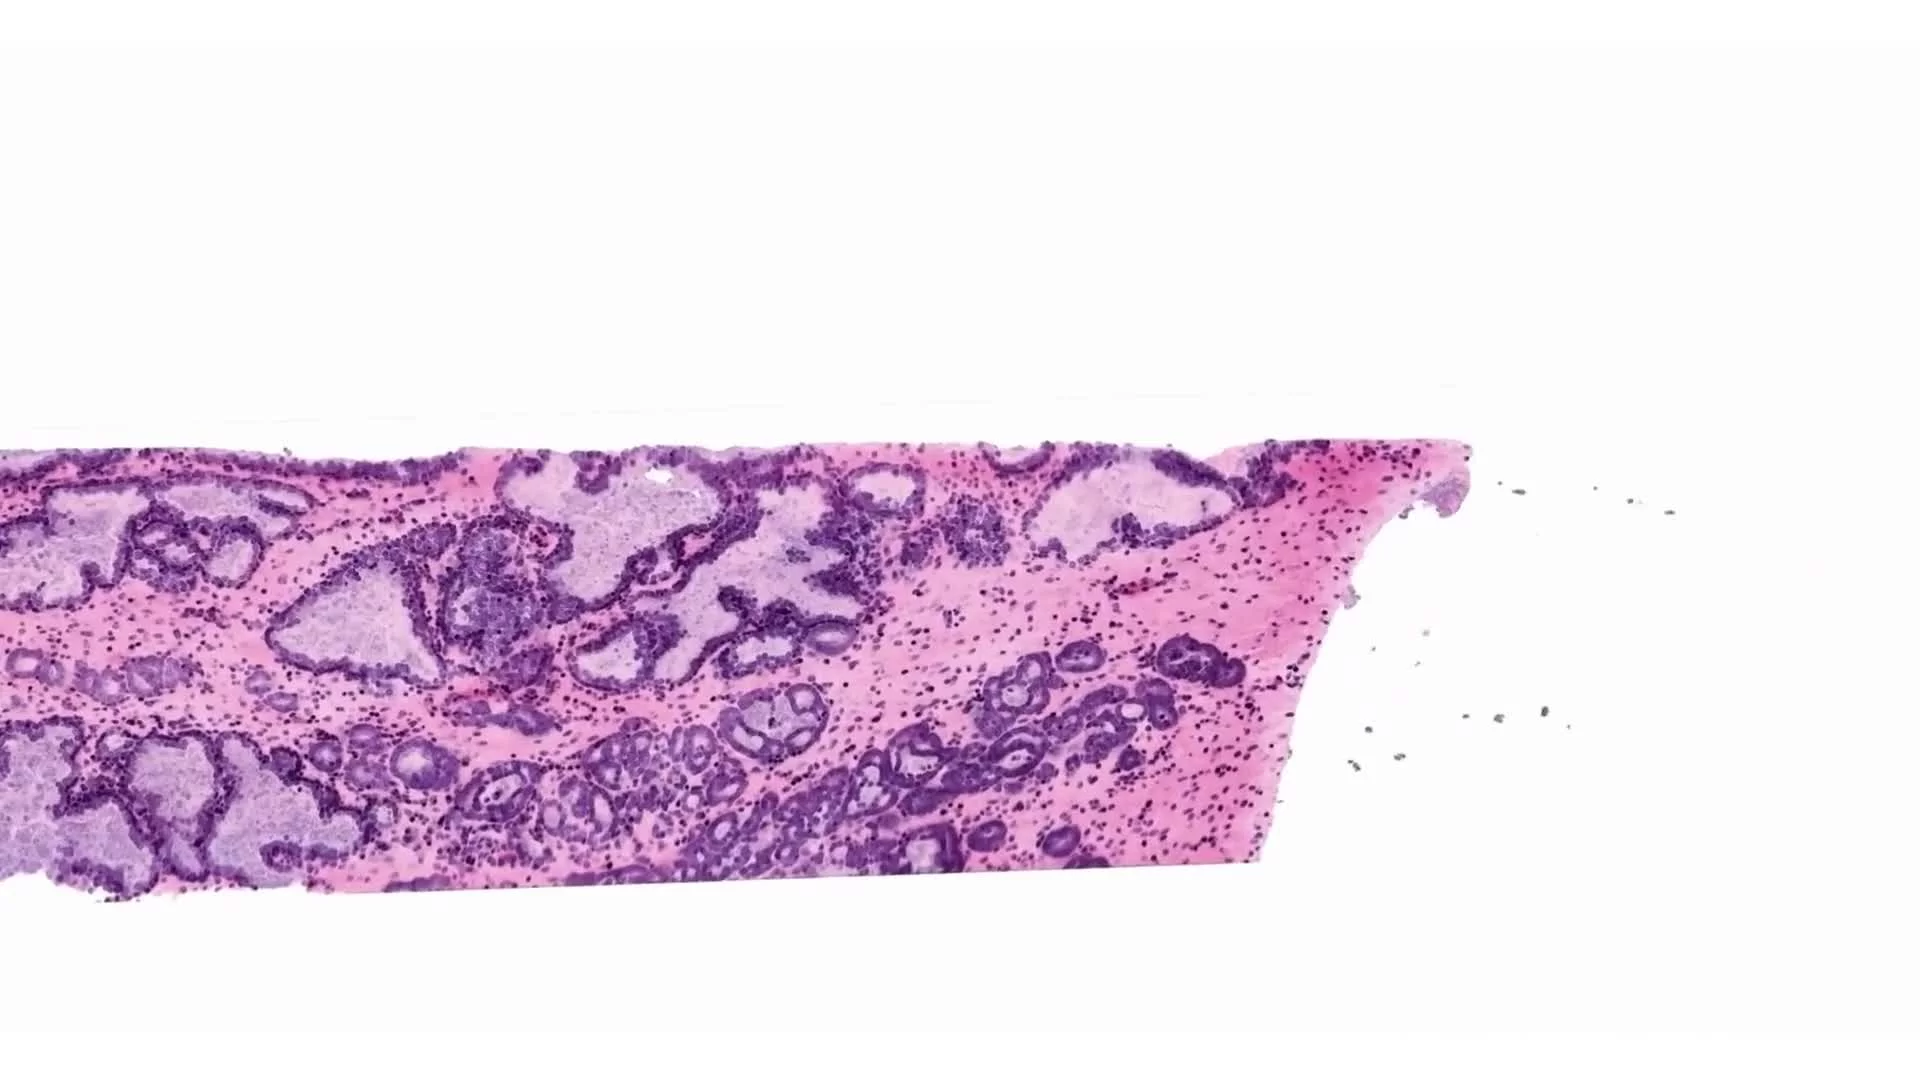
Scout-to-Zoom 3D computational H&E imaging identifies and quantifies tertiary lymphoid structures within an NSCLC tissue volume, preserving their morphology, depth, and surrounding tumor context.
This dataset presents 3D computational H&E imaging of tertiary lymphoid structures in a human non-small cell lung cancer sample.
TO-PRO-3 labels nuclei, while eosin highlights protein-rich tissue architecture. Together, the fluorescent signals are computationally rendered to create an H&E-like view of the intact tissue volume.
The Scout-to-Zoom workflow begins with rapid volumetric imaging at 2 µm per pixel to identify nuclear aggregates and other regions of interest across the tissue. Selected regions are then acquired at high resolution at 0.167 µm per pixel, revealing cellular morphology and TLS organization in greater detail.
In this NSCLC sample, Scout imaging identified dense nuclear aggregates that were examined using Zoom imaging and classified as two distinct tertiary lymphoid structures approximately 200 µm below the tissue surface. Their volumes and surface areas were quantified in 3D.
The dataset supports measurement of TLS number, volume, surface area, cellular density, distribution, and spatial relationships with surrounding tumor and stromal regions. Preserving each structure across depth reduces the sampling and orientation effects associated with individual 2D sections.
Explore how 3D tissue imaging supports immuno-oncology research across tumor architecture, immune-cell organization, and spatial relationships.
The tissue was imaged using the Aurora 3D™ Spatial Biology Solution, including the 3Di™ Hybrid Open-Top Light-Sheet microscope.

Computational H&E staining combined with non-destructive 3D imaging reveals the true complexity of tertiary lymphoid structures (TLS) in NSCLC. Unlike thin 2D sections that risk misclassification, Alpenglow’s 3Di platform captures entire TLS morphology, volume, and cellular composition, delivering accurate insights into immune architecture and tumor context.
Tertiary lymphoid structures (TLS) are critical immune aggregates that influence prognosis and response to immunotherapy in non-small cell lung cancer (NSCLC). Traditional single cross-section imaging often misrepresents TLS size, cellular composition, and maturity classification due to sampling bias.
Using Alpenglow’s 3Di spatial imaging platform and computational H&E staining, TLS can be visualized and quantified across entire tumor biopsies in 3D, non-destructively.
Computational H&E staining replicates the contrast of standard histology while preserving the intact tissue. In this NSCLC study, samples were stained with:
TO-PRO-3: nuclear marker for hematoxylin contrast
Eosin to highlight cytoplasm and extracellular matrix
After staining, the tissues were optically cleared and imaged at whole-block scale using Scout mode, followed by imaging at subcellular resolution in Zoom mode. This workflow maintains architectural context while enabling single-cell segmentation in 3D.
Key advantages:
Accurate detection and measurement of TLS in whole tissue samples
3D quantification of TLS volume, surface area, and cellular density
Improved classification of TLS maturity and organization
Enhanced biological insight through visualization of spatial context with surrounding tumor, stroma, and vasculature
In one NSCLC sample, what appeared as a single TLS in 2D was revealed in 3D to be two distinct structures with unique volumes and surface areas. Such insights demonstrate the power of combining computational H&E with 3D imaging to reveal structures invisible to conventional pathology.
By moving beyond 2D, researchers gain a more accurate and comprehensive understanding of TLS in oncology samples—opening new opportunities for translational research, biomarker development, and therapeutic discovery.
Read the TLS white paper.
3D segmentation of prostate glands using synthetic CK8 immunofluorescence derived from fluorescent H&E analogues. By combining image-translation models with traditional computer-vision methods, researchers achieved whole-biopsy 3D gland segmentation without manual labeling.
This study demonstrates annotation-free 3D segmentation of prostate glands using fluorescence-based microscopy and AI. A prostate specimen stained with a fluorescent analogue of H&E was converted into a synthetic CK8 immunofluorescence dataset via an image-sequence translation model trained on paired H&E analogue and real CK8 datasets. Traditional computer-vision algorithms were then applied to the synthetic CK8 images for segmentation of gland epithelium, lumen, and stromal regions. The synthetic CK8 image blocks were mosaicked to reconstruct a 3D CK8 dataset of the entire biopsy, enabling accurate gland segmentation. Gland lumen spaces were further segmented by filling regions enclosed by epithelia, with refinements from the cytoplasm (eosin) channel.
3D images acquired with the Aurora™ 3Di Hybrid Open Top Light Sheet (HOTLS) microscope.
With integration of 3Dm data management and 3Dai AI-powered segmentation, researchers can perform reproducible, high-content quantification. This 3D approach eliminates slice bias and ensures accurate analysis at scale.
3D imaging of mouse colorectal tumor stained with CD3, B220, and YoPro1 reveals tertiary lymphoid structures (TLS) in full spatial context.
This dataset showcases a 3D visualization of a mouse colorectal tumor, imaged on the Aurora™ 3Di Hybrid Open Top Light Sheet (HOTLS) microscope to reveal key immune populations in their native spatial context.
Stains used:
CD3 (Purple): Labels T cells
B220 (Green): Marks B cells
YoPro1 (Blue): Highlights nuclei
Within the tumor microenvironment, two tertiary lymphoid structures (TLS) are clearly visible, their complex organization preserved in full volumetric detail. TLS are dynamic, three-dimensional immune aggregates that are often overlooked in thin-section histology.
By combining light-sheet imaging with 3Dm data management and 3Dai AI-powered segmentation, the full tumor volume was imaged without slicing, enabling TLS segmentation, quantification, and spatial profiling. Researchers can measure TLS size, density, immune cell composition, and their relationships to tumor structures with unprecedented accuracy.
This dataset highlights how 3D histology, digital pathology, and spatial profiling uncover critical immune features, delivering insights essential for immuno-oncology research and advancing biomarker discovery.
Discover more in our TLS White Paper.
3D fluorescence imaging of human lung tissue stained with Fast Green reveals collagen architecture for fibrosis and tissue remodeling research.
This 3D dataset reveals the intricate extracellular matrix of the human lung, captured with the Aurora™ 3Di Hybrid Open Top Light Sheet (HOTLS) microscope on Alpenglow’s 3D digital pathology platform. Collagen is stained with Fast Green and rendered in vivid detail, exposing the structural complexity and functional organization of lung tissue.
Unlike conventional 2D histology, this workflow images thick, intact tissue with no slicing or sectioning. The result is a distortion-free, spatially preserved view of the lung microenvironment, enabling accurate analysis of tissue architecture in its native state.
Through integration with 3Dm data management and 3Dai AI-powered segmentation, collagen orientation, density, and organization can be quantified across the tissue volume. These insights provide a deeper understanding of how collagen remodeling drives fibrosis, structural changes in tissue remodeling, and disease progression.
This dataset demonstrates the power of 3D histology and spatial profiling in lung research and translational studies.
Tissue provided by AnaBios.
3D imaging of human skin biopsy stained with tryptase, TO-PRO-3, and PGP9.5 reveals mast cell–nerve interactions for dermatology and oncology research.
This dataset presents an intact, fluorescence-labeled human skin biopsy imaged in true 3D with the Aurora™ 3Di Hybrid Open Top Light Sheet (HOTLS) microscope. The volumetric view reveals the native architecture of neuroimmune interactions that conventional 2D slices cannot capture.
Stains used:
Tryptase (Green): Labels mast cells
TO-PRO-3 (Blue): Marks nuclei
PGP9.5 (Red): Traces nerves
By preserving full cell morphology and spatial relationships, this dataset provides the ground truth for quantifying mast cell density, mapping nerve proximity, and investigating mechanisms underlying chronic itch, fibrosis, and inflammatory skin disorders.
With integration of 3Dm data management and 3Dai AI-powered segmentation, researchers can perform reproducible, high-content quantification of neuroimmune interactions. This 3D approach eliminates slice bias and ensures accurate analysis at scale.
Applications span translational dermatology, where mast cells play a role in inflammatory skin disease, and immuno-oncology, where mast cell–nerve dynamics may influence tumor microenvironments. This example illustrates how 3D histology and digital pathology offer actionable insights that extend beyond visualization to measurable data.
3D imaging of prostate organoids stained with TO-PRO-3 and eosin reveals spatial heterogeneity, cellular interactions, and microenvironmental detail.
At the frontier of cellular research, three-dimensional fluorescence imaging is redefining how scientists study prostate organoids. Unlike traditional 2D microscopy, which flattens complex structures, 3D imaging preserves the full architecture of these miniature organs, exposing biological subtleties that thin slices overlook.
Stains used:
TO-PRO-3: Highlights nuclei
Eosin: Labels cytoplasmic structures (pseudocolored for enhanced detail)
Using the Aurora™ 3Di Hybrid Open Top Light Sheet (HOTLS) microscope, organoids are imaged layer by layer, generating vivid, information-rich datasets. With integration into 3Dm data management and 3Dai AI-powered segmentation, researchers can quantify nuclear organization, cytoplasmic morphology, and spatial heterogeneity across entire organoids.
This volumetric approach provides unmatched clarity into cellular interactions, microenvironmental gradients, and spatial variability, offering transformative insights for prostate cancer modeling, drug testing, and precision medicine.
By moving beyond 2D limitations, 3D digital pathology empowers organoid studies with true biological context.
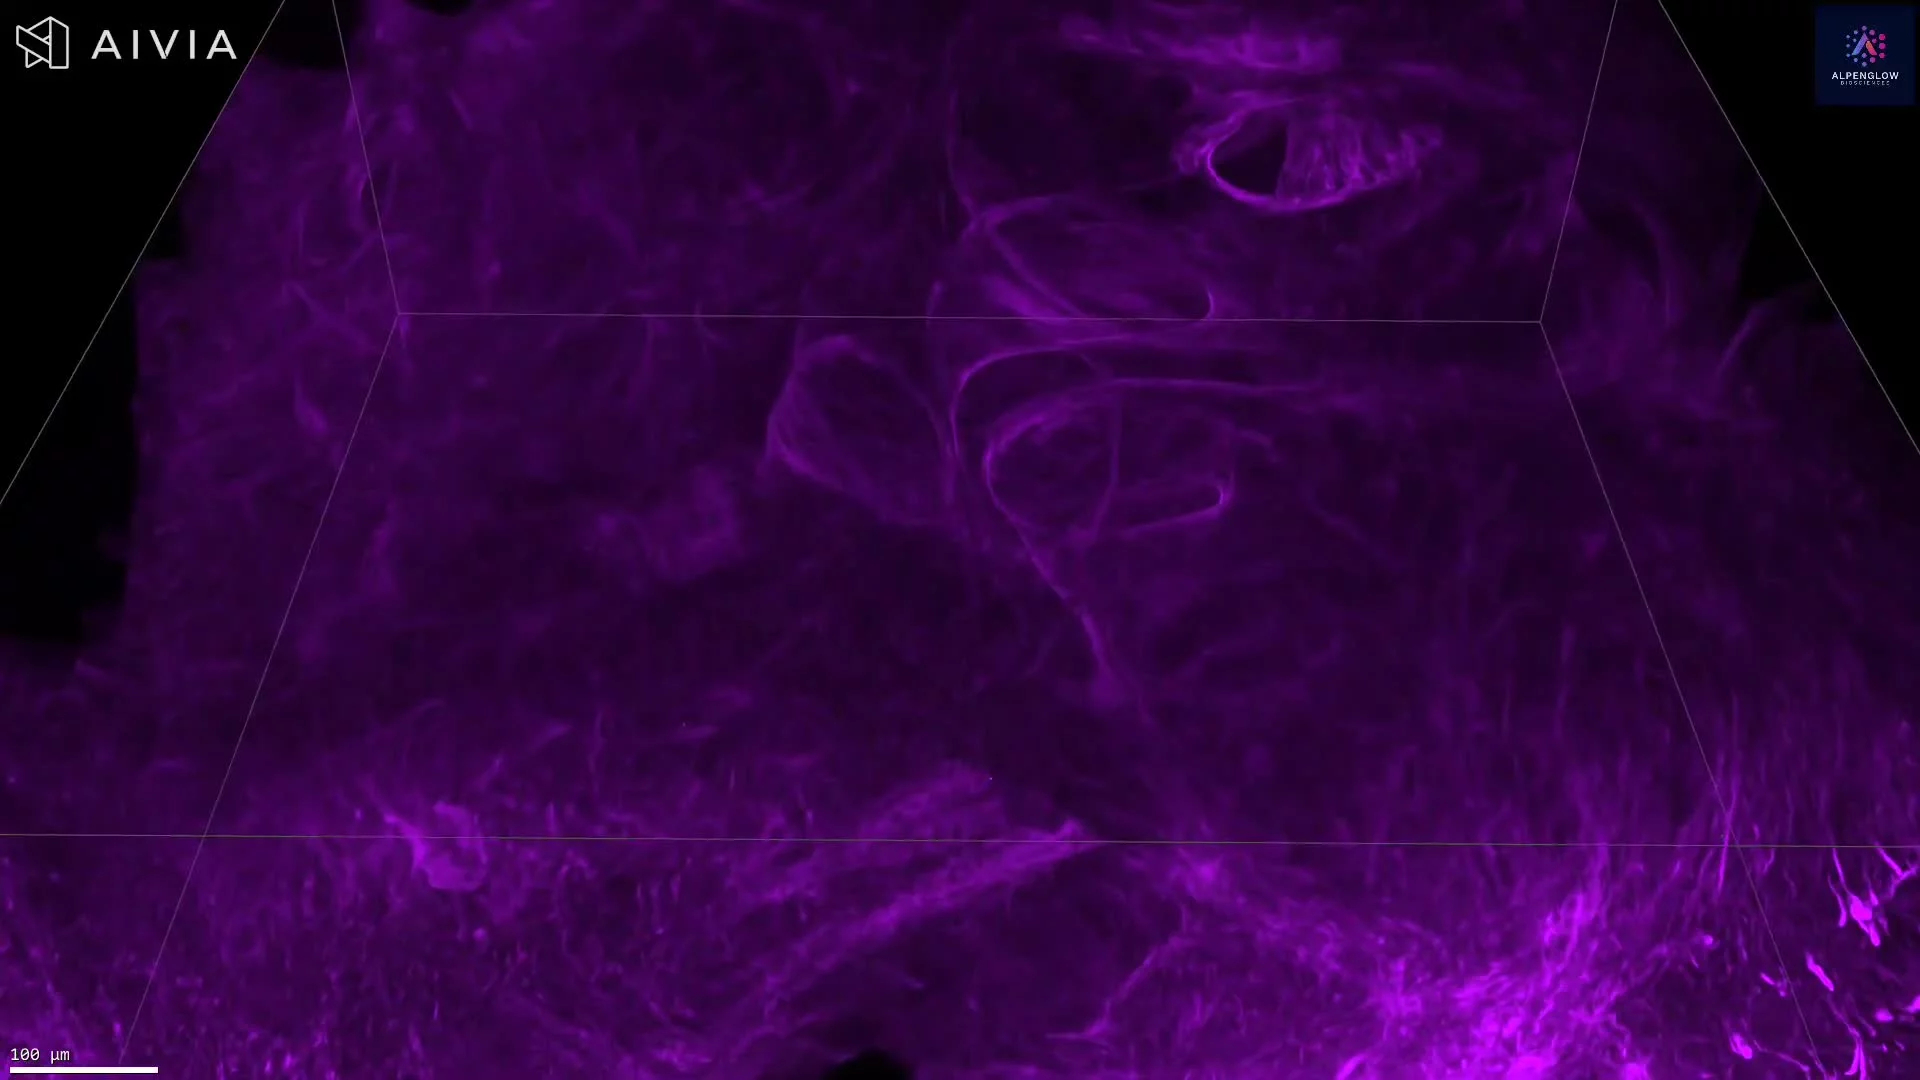
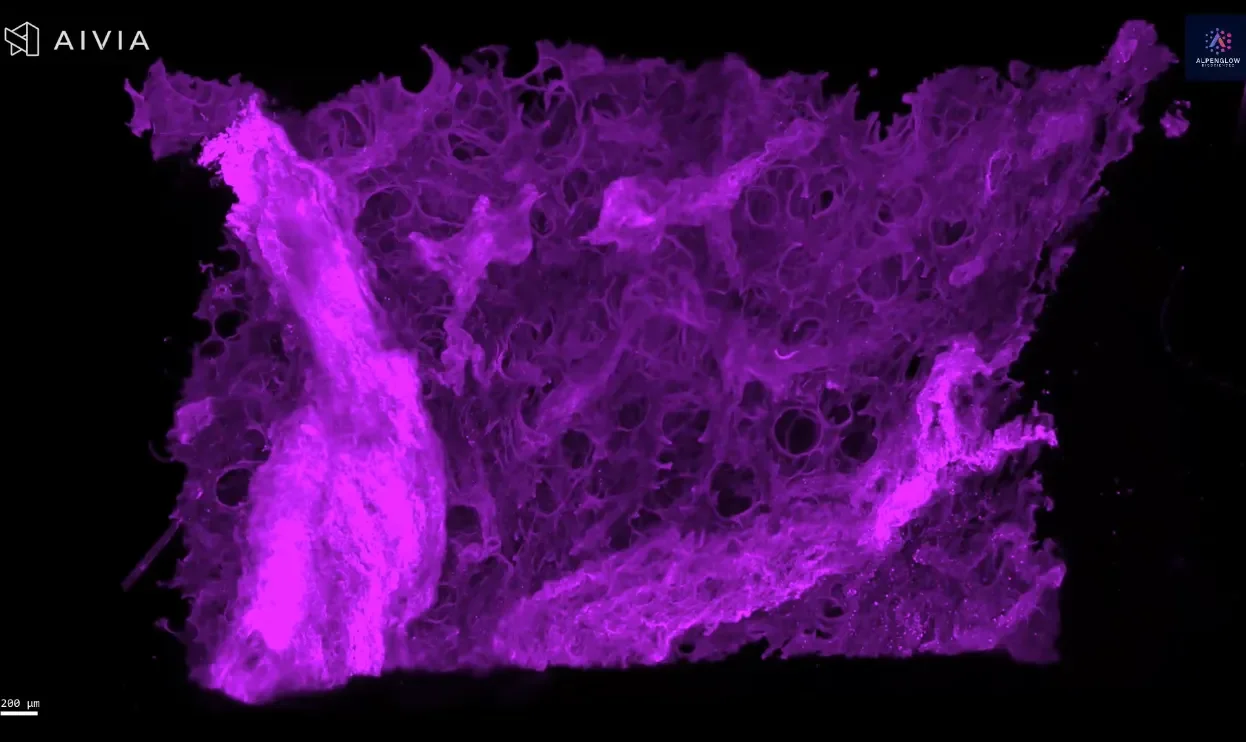
3D fluorescence imaging of prostate tissue stained with Fast Green reveals the collagen architecture, orientation, and density, providing insights beyond 2D histology.
This dataset explores the structural complexity of prostate tissue using 3D fluorescence imaging on the Aurora™ 3Di Hybrid Open Top Light Sheet (HOTLS) microscope. Collagen is stained with Fast Green and rendered in vivid purple, revealing its essential role in shaping tissue architecture, influencing disease progression, and guiding therapeutic strategies.
Unlike traditional thin-sectioning, Alpenglow’s 3D digital pathology platform digitally sections intact tissue without slicing, preserving the full spatial context. This enables the visualization of collagen organization, density, and orientation in relation to surrounding cells, which are often overlooked in 2D histology.
Through integration with 3Dm data management and 3Dai AI-powered segmentation, collagen patterns can be quantified with cellular-level precision, supporting spatial profiling and high-content tissue analysis.
Applications extend to cancer research, fibrosis, and translational studies, where understanding collagen remodeling is critical for advancing biomarker development and therapeutic design.
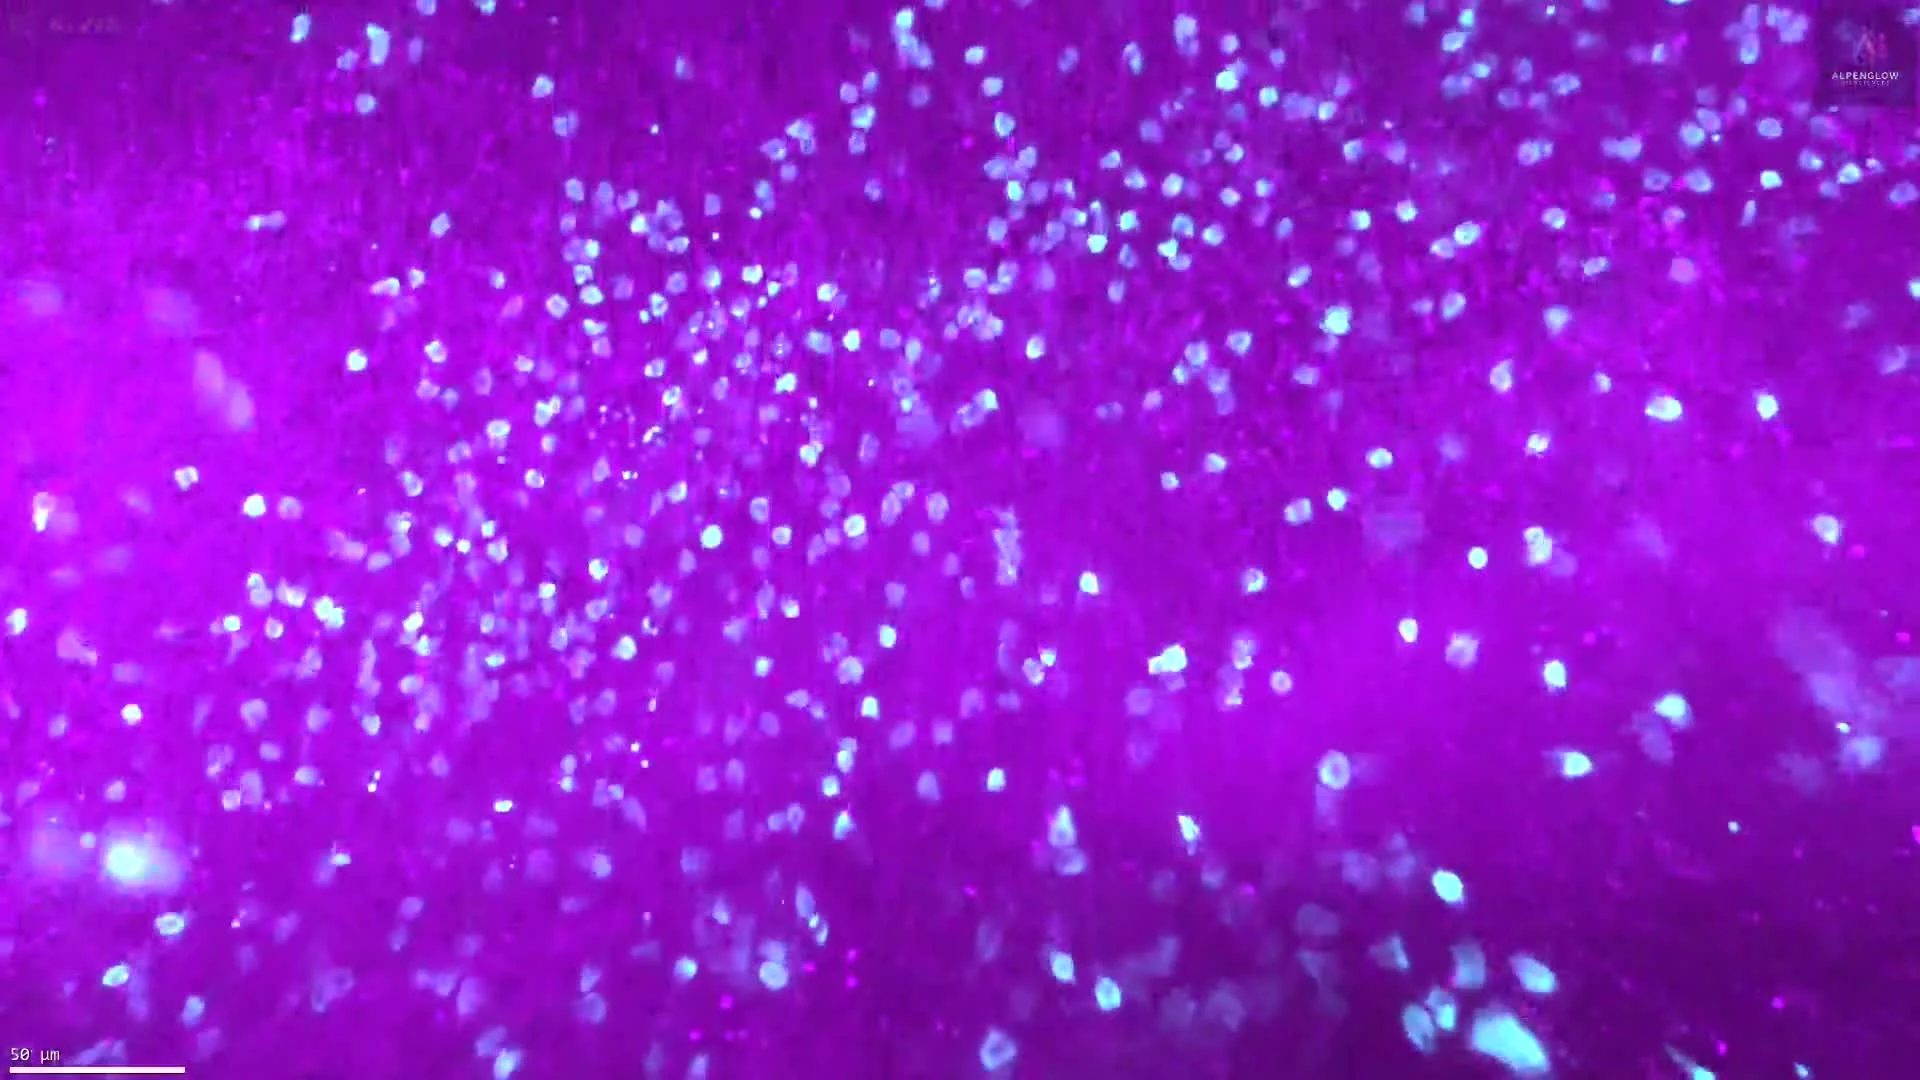
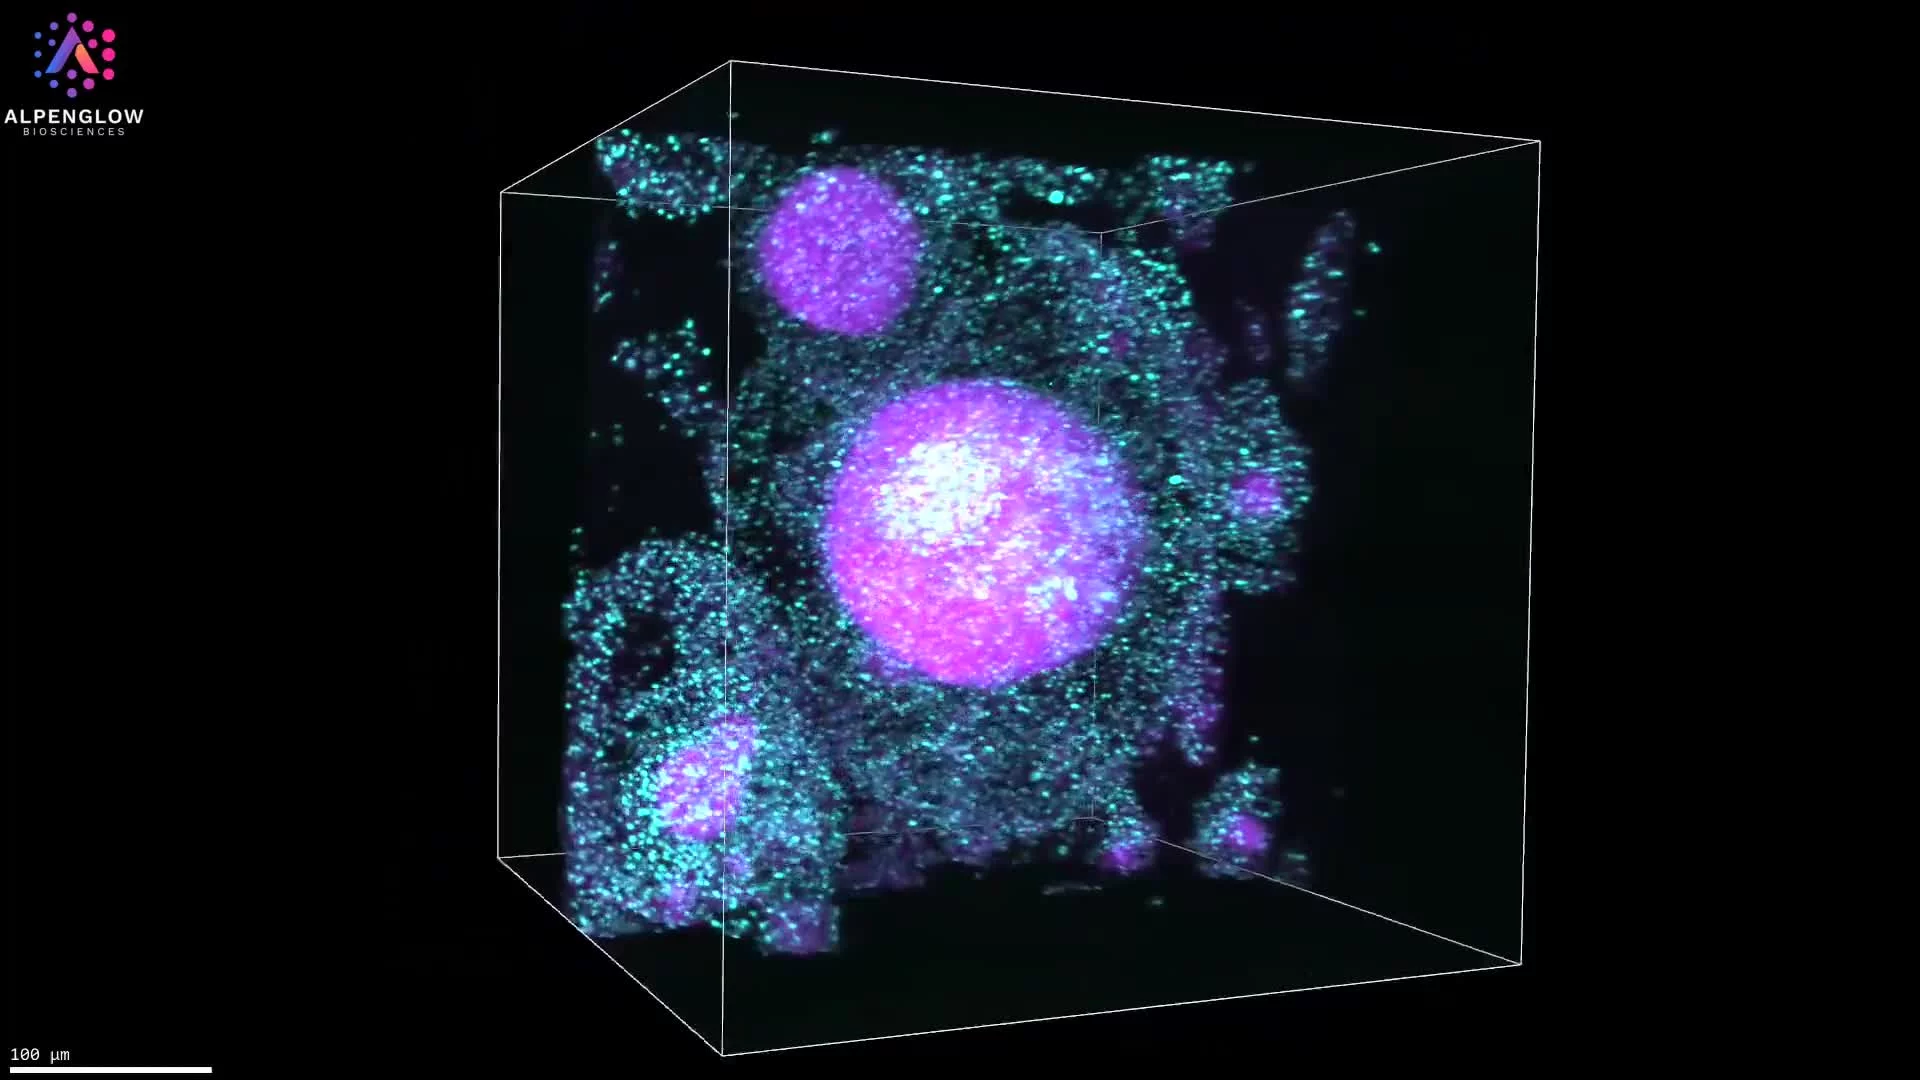
High-resolution 3D imaging of human tonsil tissue stained with YO-PRO-1 for nuclei and tryptase for mast cells.
This visualization demonstrates the power of 3D fluorescence imaging at Zoom resolution using the Aurora™ 3Di Hybrid Open Top Light Sheet (HOTLS) microscope. A human tonsil sample (~800 µm in length) is imaged in full depth, capturing structural and cellular relationships that are lost in traditional 2D slices.
Stains used:
YO-PRO-1 (Purple): Labels nuclei
Tryptase (Cyan): Highlights mast cells — critical players in allergic responses, inflammation, and tumor microenvironments
By combining whole-tissue integrity with high-resolution 3D histology, this dataset reveals the spatial distribution of mast cells in their native context. Integration with 3Dm data management and 3Dai AI-powered segmentation enables quantification of mast-cell density and proximity to other immune or stromal structures.
Understanding mast cell biology in situ is crucial for advancing immunology research, dermatology, and immuno-oncology, where mast cells play a significant role in both inflammation and cancer progression.
Curious about the antibody used? This is from Abcam, Cat: ab2378, Clone: [AA1], https://www.abcam.com/en-us/products/primary-antibodies/mast-cell-tryptase-antibody[…]sltid=AfmBOoqottEqHLRMk43Xza7e0WYltzxI64-3fpUIGDxi0DXcz7tJhEA_
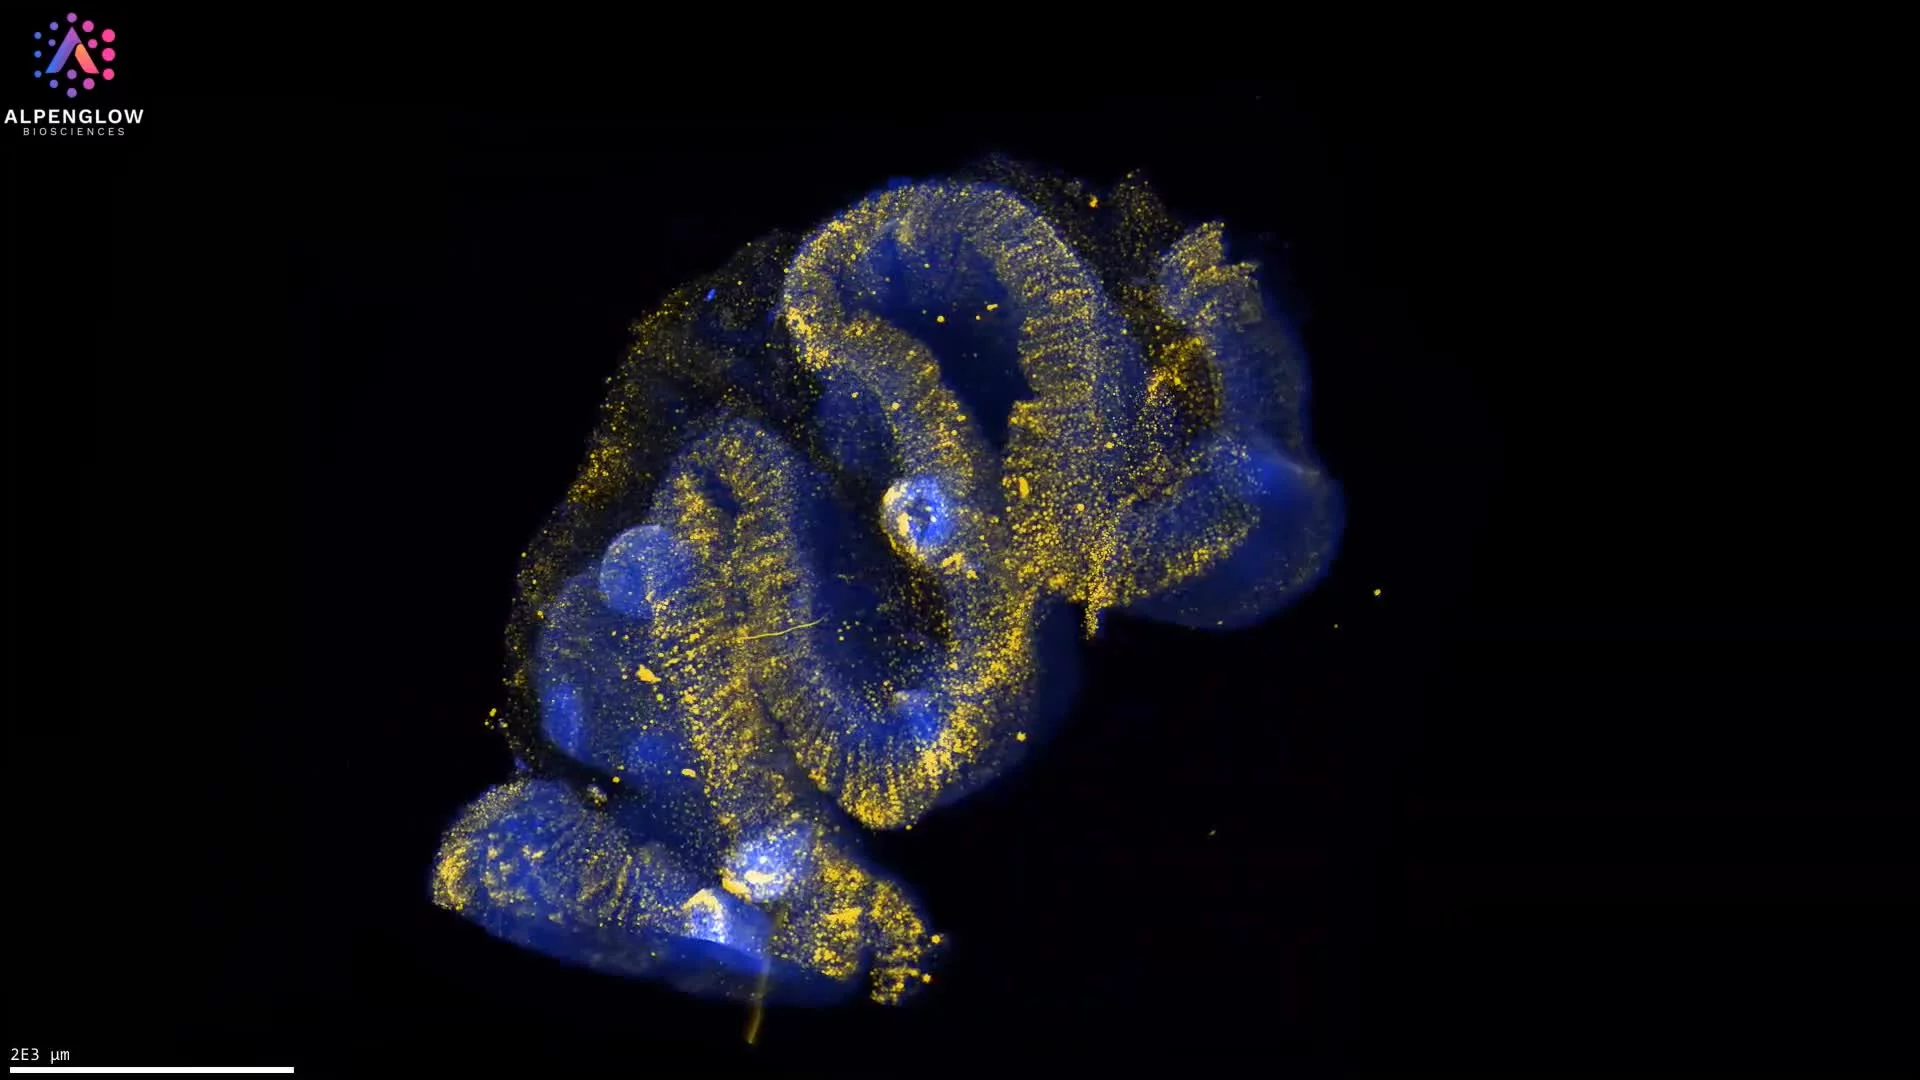
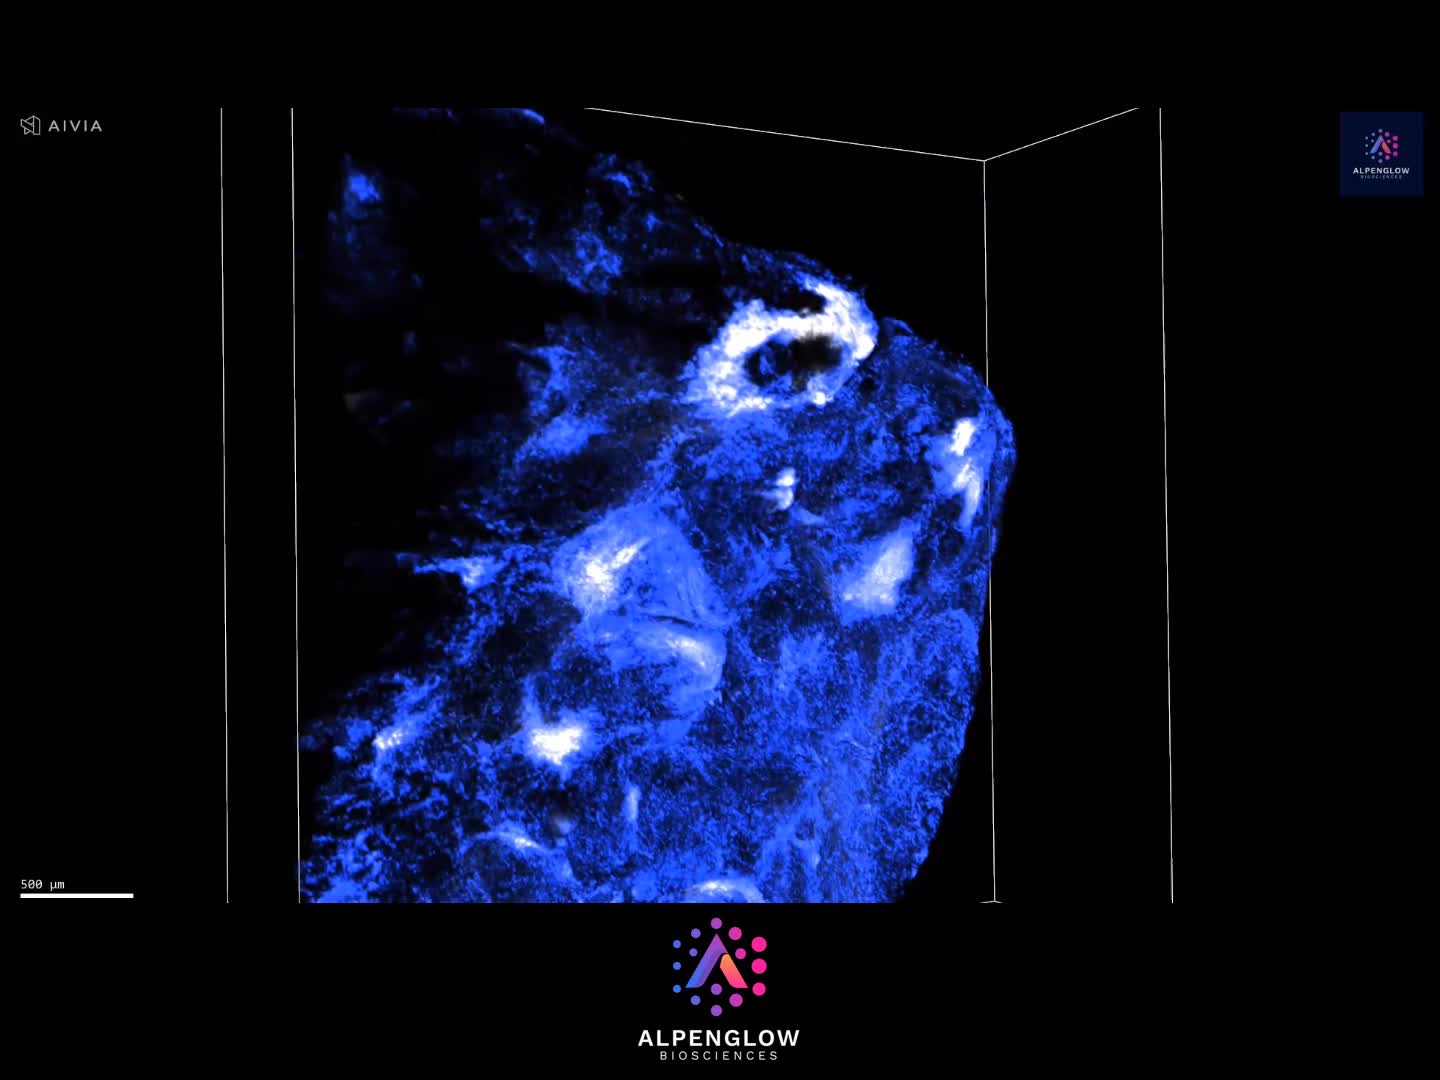
3D imaging and AI-powered analysis quantify CD8-positive cells within an approximately 6 × 4.3 × 4.2 mm volume of FFPE normal-adjacent colorectal tissue, preserving regional immune organization and heterogeneity across depth.
This dataset presents 3D imaging and quantitative analysis of human FFPE normal-adjacent colorectal tissue, preserving CD8-positive cell distribution across an approximately 6 × 4.3 × 4.2 mm tissue volume.
The FFPE tissue was deparaffinized, processed using a modified iDISCO+ clearing protocol, and stained with YO-PRO-1, shown in blue, to label nuclei and an anti-CD8 antibody, shown in yellow, to identify CD8-positive cells.
The tissue was acquired at 2 µm per pixel, providing a volumetric view of immune-cell distribution across depth. Unlike measurements derived from selected sections, the intact dataset captures regional variation in CD8-positive cell density, clustering, and spatial organization throughout the tissue volume.
Using 3Dm™ data management and 3Dai™ AI-powered segmentation, CD8-positive cells were quantified across the dataset. The resulting measurements support spatial profiling of immune infiltration, regional heterogeneity, cell density, clustering, and distances between CD8-positive cells and surrounding tissue structures.
Explore how 3D tissue imaging supports immuno-oncology research across tumor architecture, immune-cell organization, and spatial relationships.
The tissue was imaged using the Aurora 3D™ Spatial Biology Solution, including the 3Di™ Hybrid Open-Top Light-Sheet microscope.
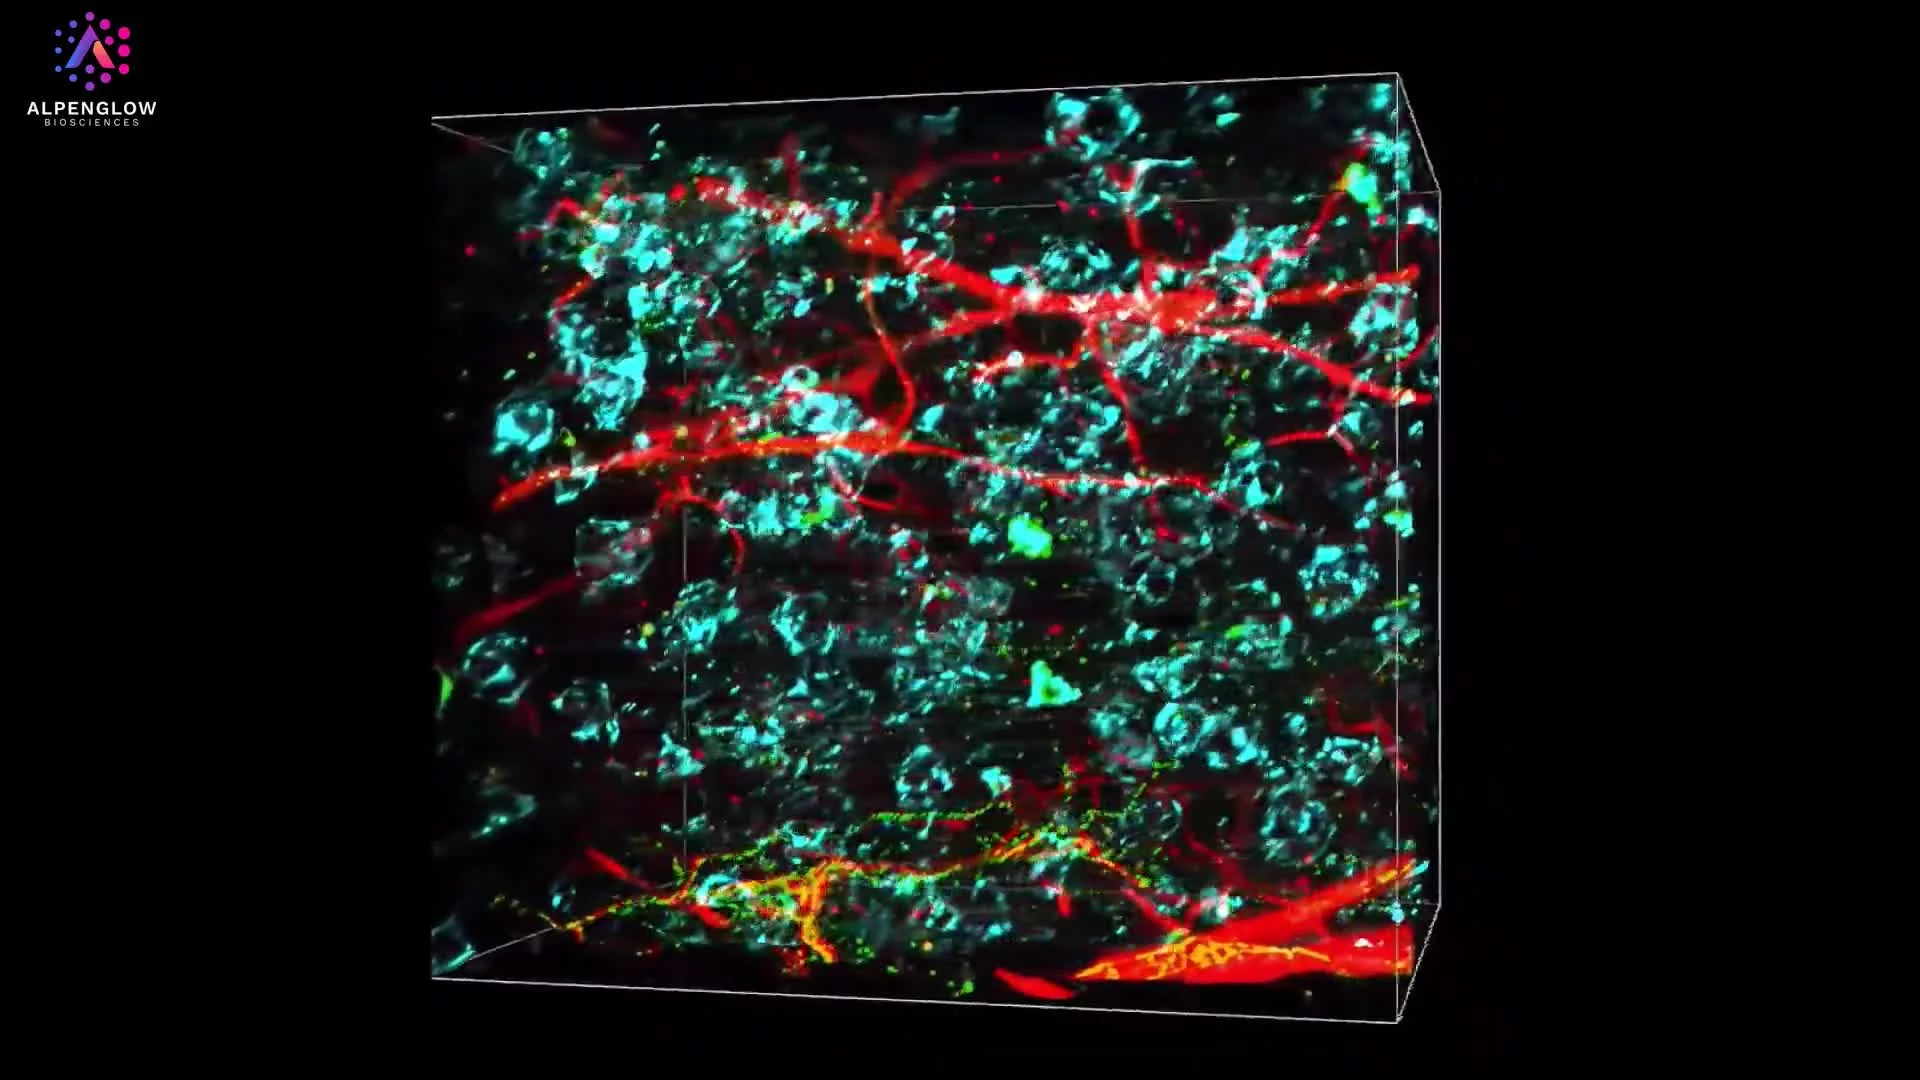
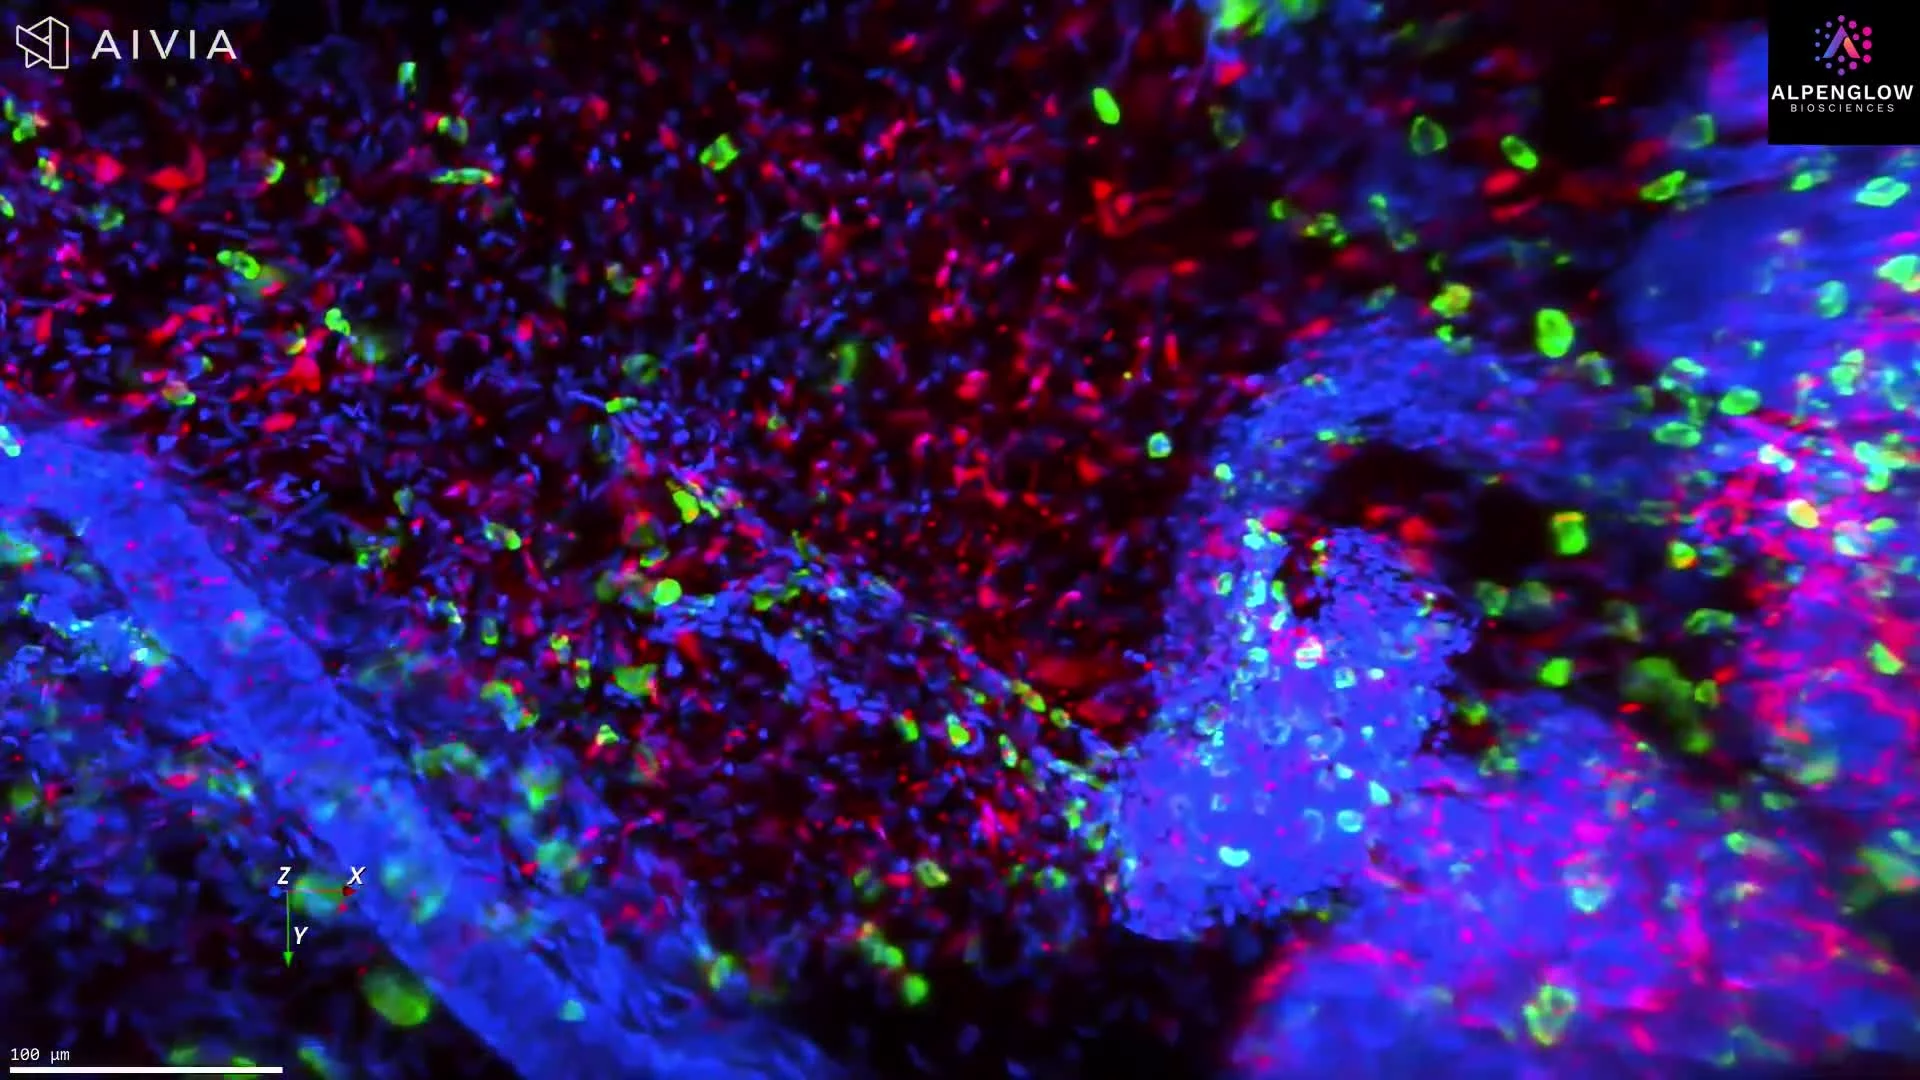
3D imaging of cleared mouse fat pad reveals blood vessels, macrophages, and nerves labeled with lectin, CD68, and PGP9.5.
This dataset presents a cleared, triple-labeled mouse fat pad imaged in 3D, preserving vascular, immune, and neural structures across the intact tissue volume.
Lectin, shown in red, highlights the vascular network. CD68, shown in turquoise, identifies macrophage-associated cells, while PGP9.5, shown in green, traces nerve fibers throughout the adipose tissue.
The volumetric view reveals the distribution and spatial relationships of blood vessels, CD68-positive cells, and nerves within the surrounding tissue architecture. Preserving these structures across depth enables investigation of immune–neural–vascular organization that can be fragmented or missed in selected 2D sections.
The dataset supports quantitative analysis of vascular density and branching, nerve density and trajectory, CD68-positive cell distribution, and distances among immune, vascular, and neural structures. These measurements are relevant to preclinical studies of adipose tissue biology, inflammation, remodeling, metabolism, and neurovascular organization.
The tissue was imaged using the Aurora 3D™ Spatial Biology Solution, including the 3Di™ Hybrid Open-Top Light-Sheet microscope.
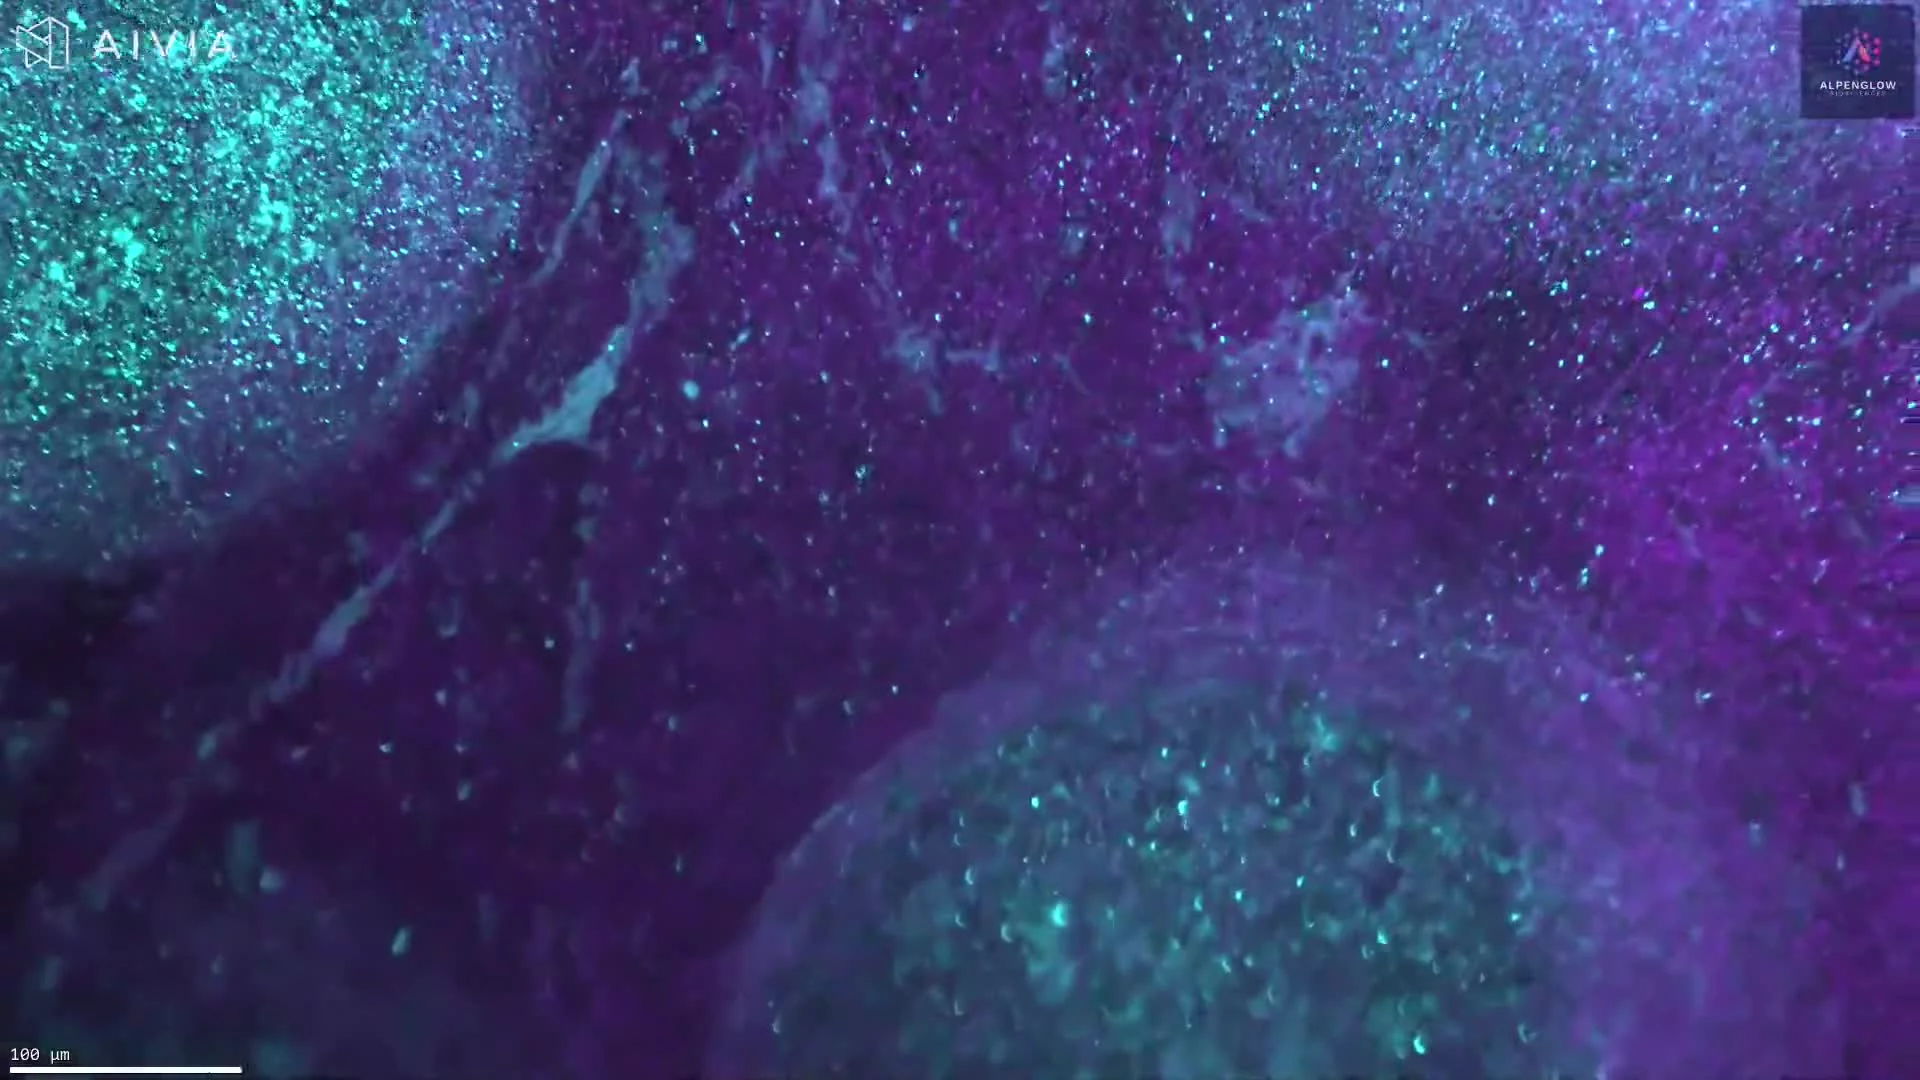
3D imaging of cleared tonsil tissue stained with anti-CD21 and TO-PRO-3 reveals B cell and follicular dendritic cell distribution in FFPE samples.
This dataset demonstrates the identification of B cells and follicular dendritic cells in formalin-fixed, paraffin-embedded (FFPE) human tonsil tissue using optimized staining and clearing protocols. Samples up to 3 mm were de-waxed, pretreated, and subject to antigen retrieval with an EDTA/Methanol buffer system. They were then stained with BioLegend anti-CD21 (clone Bu32) and the nuclear dye TO-PRO-3 (Thermo Fisher).
The tissue was cleared using a hybrid iDISCO protocol, ensuring deep antibody penetration, and imaged with the Aurora™ 3Di Hybrid Open Top Light Sheet (HOTLS) fluorescent microscope. This workflow maintains tissue architecture and enables intact 3D histology of immune cell networks in lymphoid tissue.
By combining validated antibody staining with 3Dm data management and 3Dai AI-powered segmentation, researchers can achieve quantitative mapping of B cell and dendritic cell organization.
These high-content datasets provide valuable insights for immunology research, vaccine studies, and immuno-oncology, where B cell activation and follicular dendritic cell function play critical roles in immune response.
Next step
Bring your immune biology question into 3D
Share your tissue model, immune markers, experimental conditions, and intended spatial readouts. Alpenglow can help define an intact-tissue imaging and quantitative analysis approach for your immunology study.
Explore how 3D I/O Pro™ supports immune profiling, spatial analysis, and quantitative tissue assessment.
Discuss your immunology study
Tell the Alpenglow team which immune populations, tissue structures, and spatial relationships you need to visualize or quantify.

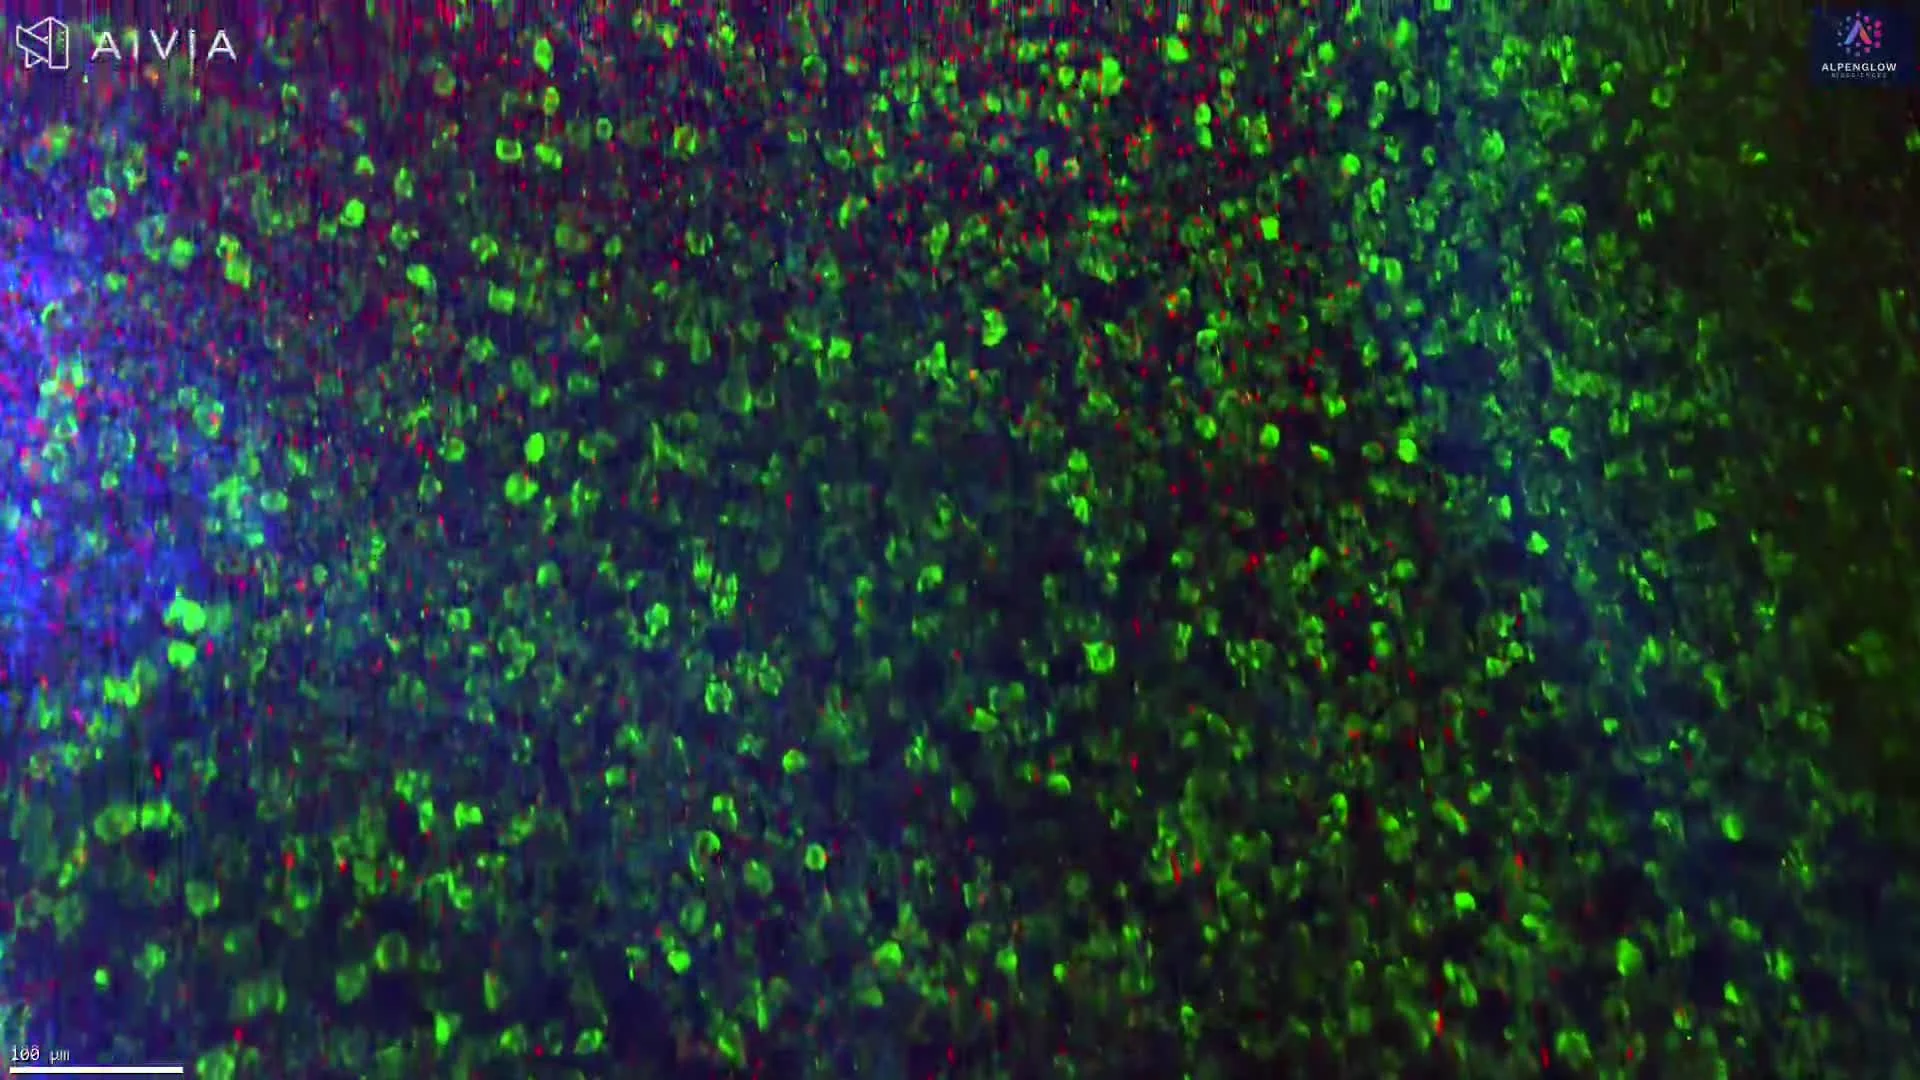
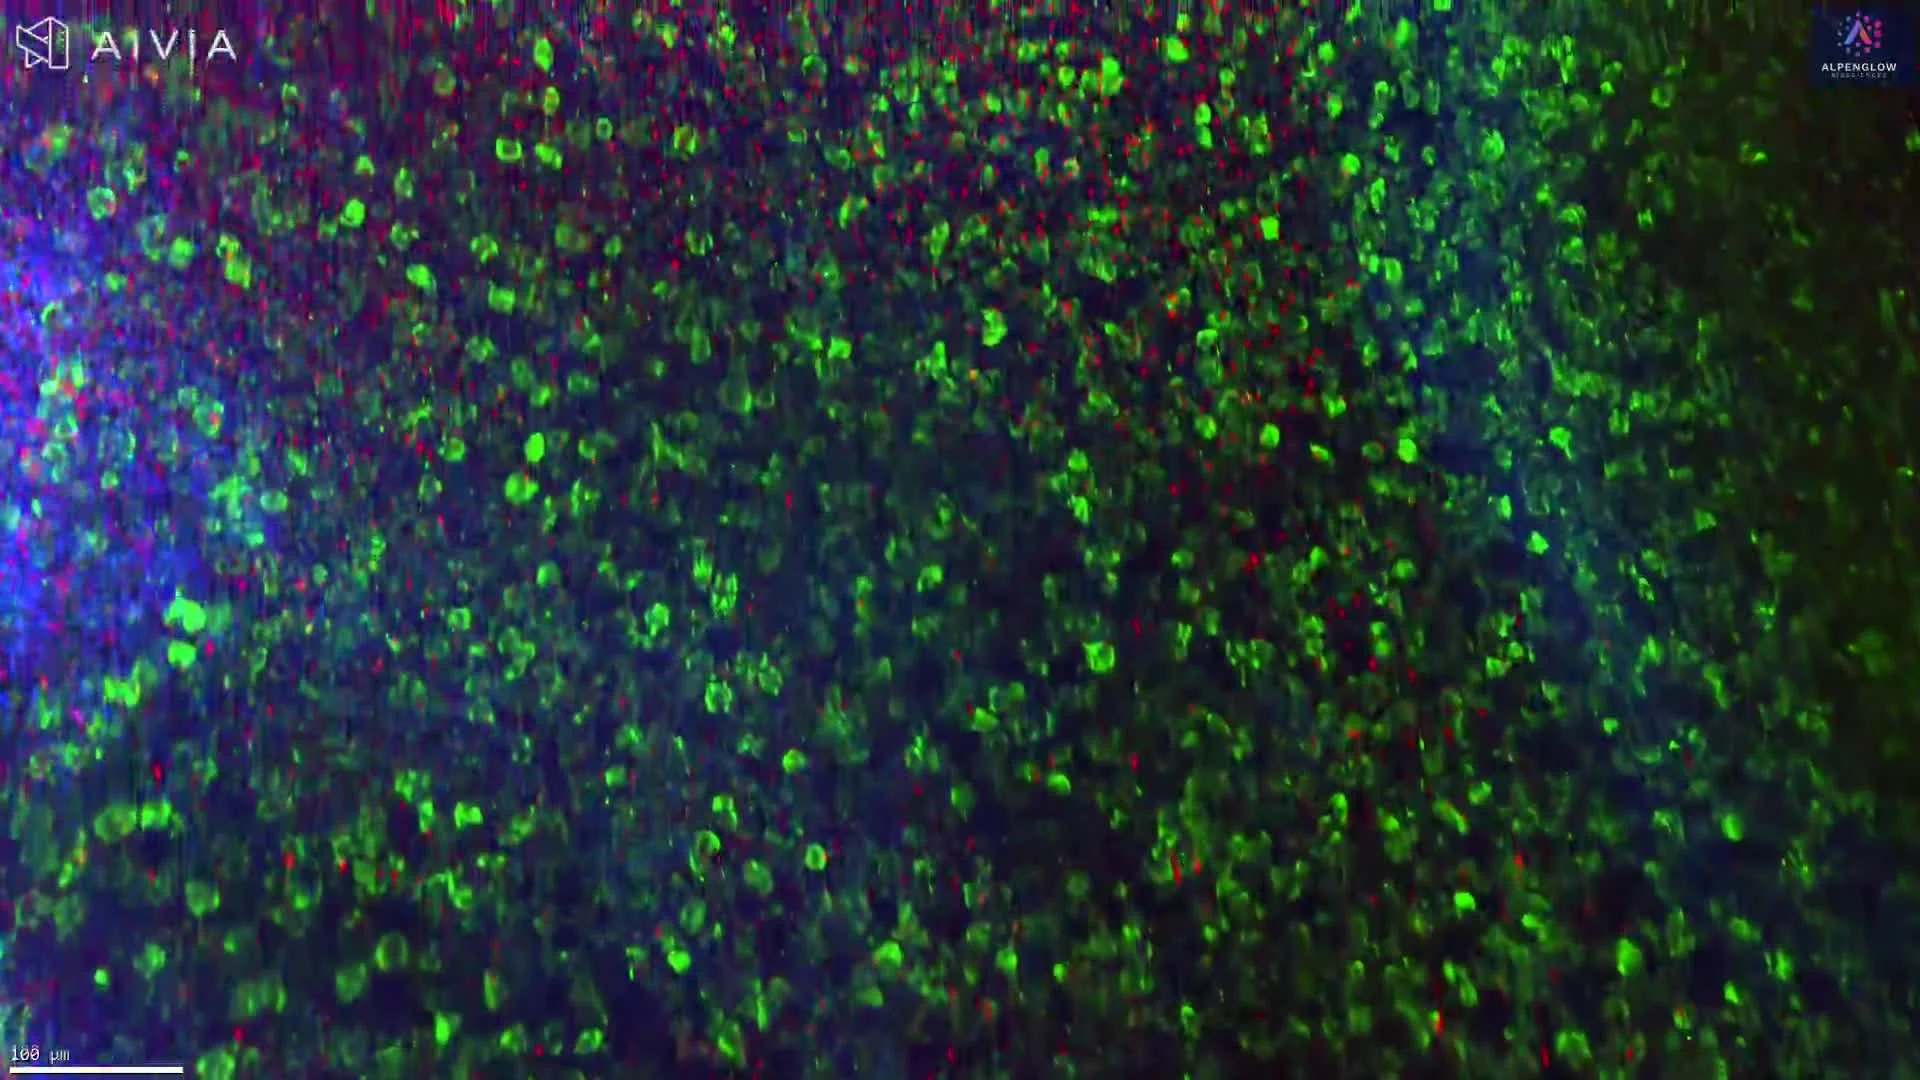
3D imaging of an intact mouse colorectal tumor reveals immune organization across the full tissue volume. B220-positive regions are shown in green, CD3-positive T cells in red, and nuclei in blue.
This video presents high-resolution 3D imaging of an intact mouse colorectal tumor, preserving immune organization across the full tissue volume.
B220, shown in green, highlights B-cell-rich regions. CD3, shown in red, identifies T-cell populations, while nuclei are shown in blue to provide cellular and tissue context. Together, these markers reveal how immune cells are distributed, clustered, and spatially organized within the tumor.
The volumetric dataset preserves regional heterogeneity and relationships between B-cell-rich and T-cell-rich areas across depth. With appropriate segmentation, it can support quantitative analysis of immune-cell density, clustering, spatial distribution, and distances between immune populations and surrounding tumor regions.
Explore how 3D tissue imaging supports immuno-oncology research across tumor architecture, immune-cell organization, and spatial relationships.
The tissue was imaged using the Aurora 3D™ Spatial Biology Solution, including the 3Di™ Hybrid Open-Top Light-Sheet microscope.