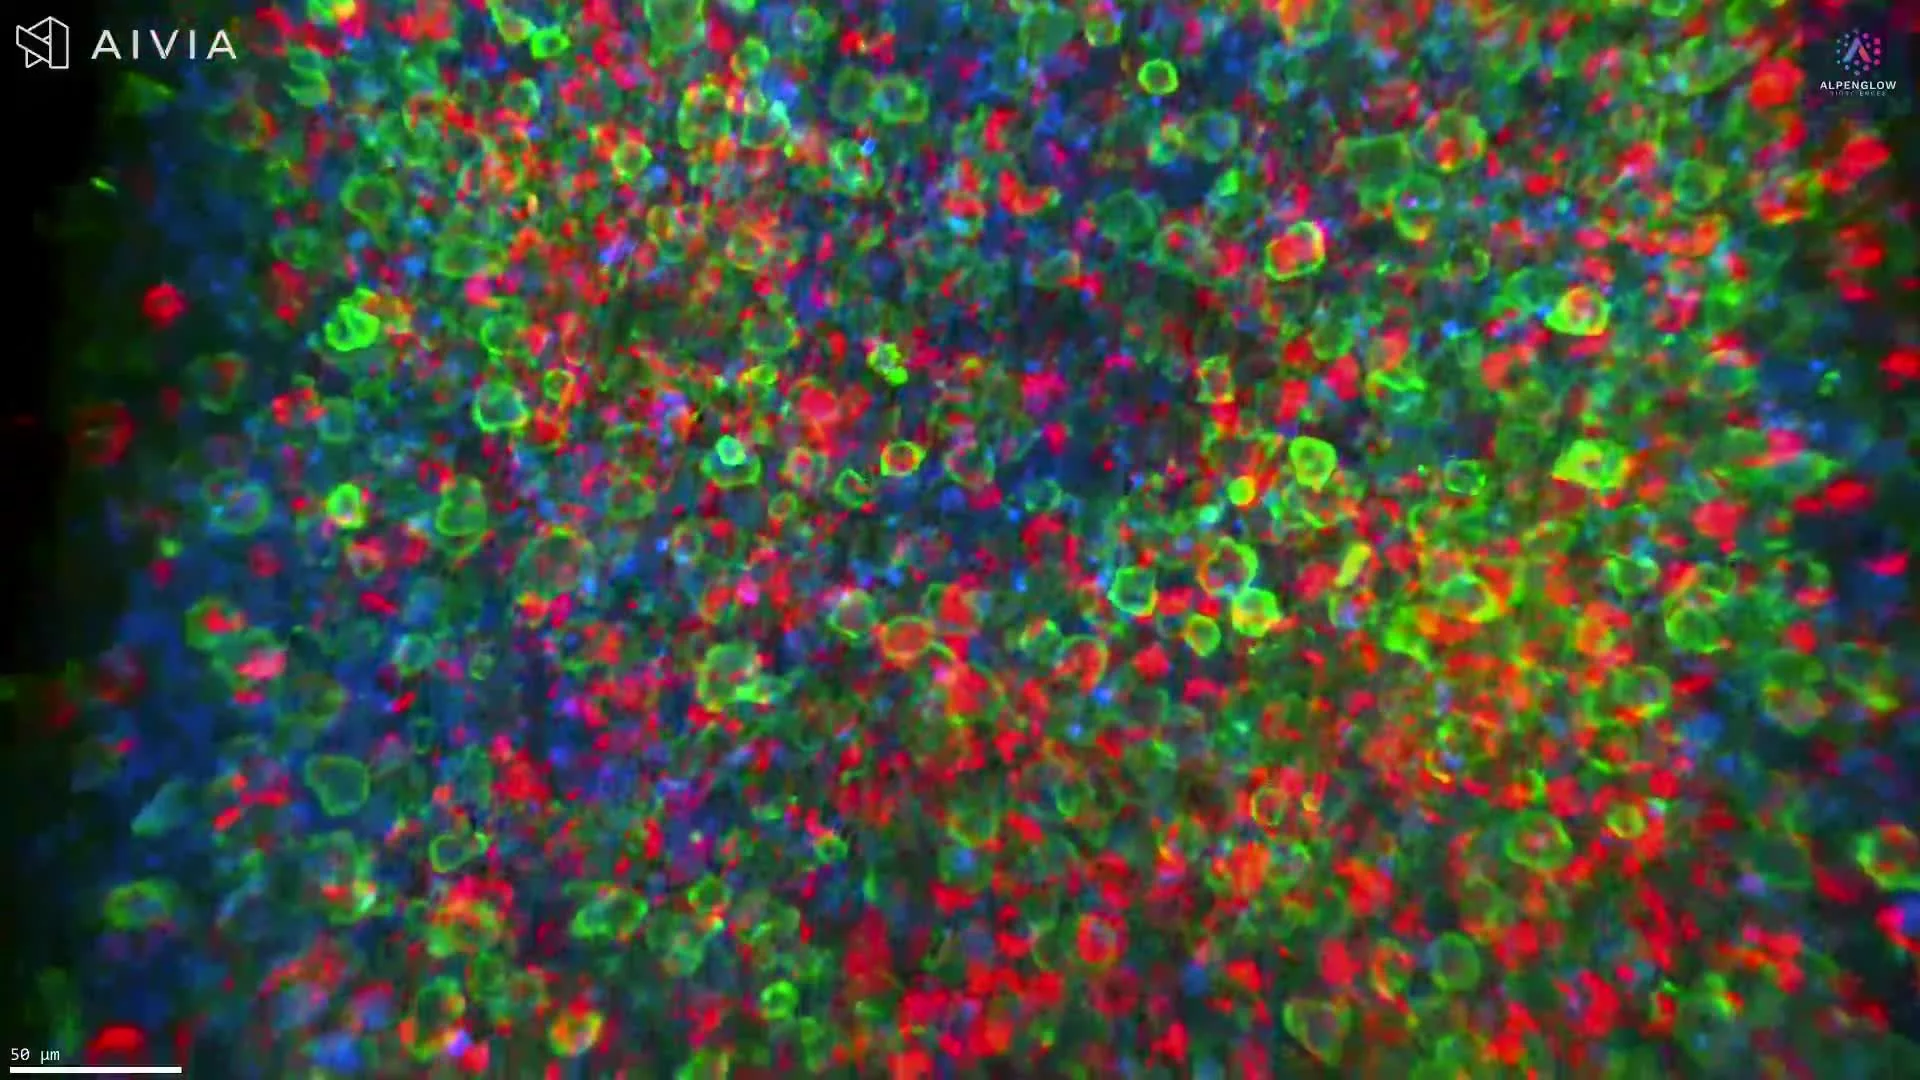
3D Immune Cell Mapping in an Intact Mouse Colorectal Tumor
This video presents 3D tissue imaging of an intact mouse colorectal tumor using light-sheet fluorescence microscopy.
B220, shown in green, highlights B-cell populations, while CD3, shown in magenta, identifies T-cell populations. Individual labeled cells can be resolved while their positions remain connected to the surrounding tumor architecture.
The volumetric view reveals differences in immune cell density, clustering, and spatial distribution throughout the tumor. Unlike measurements based on selected tissue sections, imaging the intact volume preserves immune organization across depth and supports analysis from cellular detail to tissue-scale patterns.
With appropriate segmentation, the dataset can support quantitative analysis of B220-positive and CD3-positive cell densities, clustering, regional distributions, and spatial relationships among immune populations. Organized immune aggregates can also be located for further characterization using additional markers and validated tertiary lymphoid structure criteria.
Explore how 3D tissue imaging supports immuno-oncology research across tumor architecture, immune-cell organization, and spatial relationships.
The tissue was imaged using the Aurora 3D™ Spatial Biology Solution, including the 3Di™ Hybrid Open-Top Light-Sheet microscope.