
Imaging Facility Director
3D imaging infrastructure for core facilities
Expand your core with flexible, scalable 3D imaging
Support diverse users, sample formats, and scientific applications with a multi-scale light-sheet imaging workflow built for intact tissue. The 3D imaging platform combines whole-sample Scout acquisition, high-resolution Zoom imaging, flexible sample access, and streamlined microscope control for reproducible volumetric datasets.
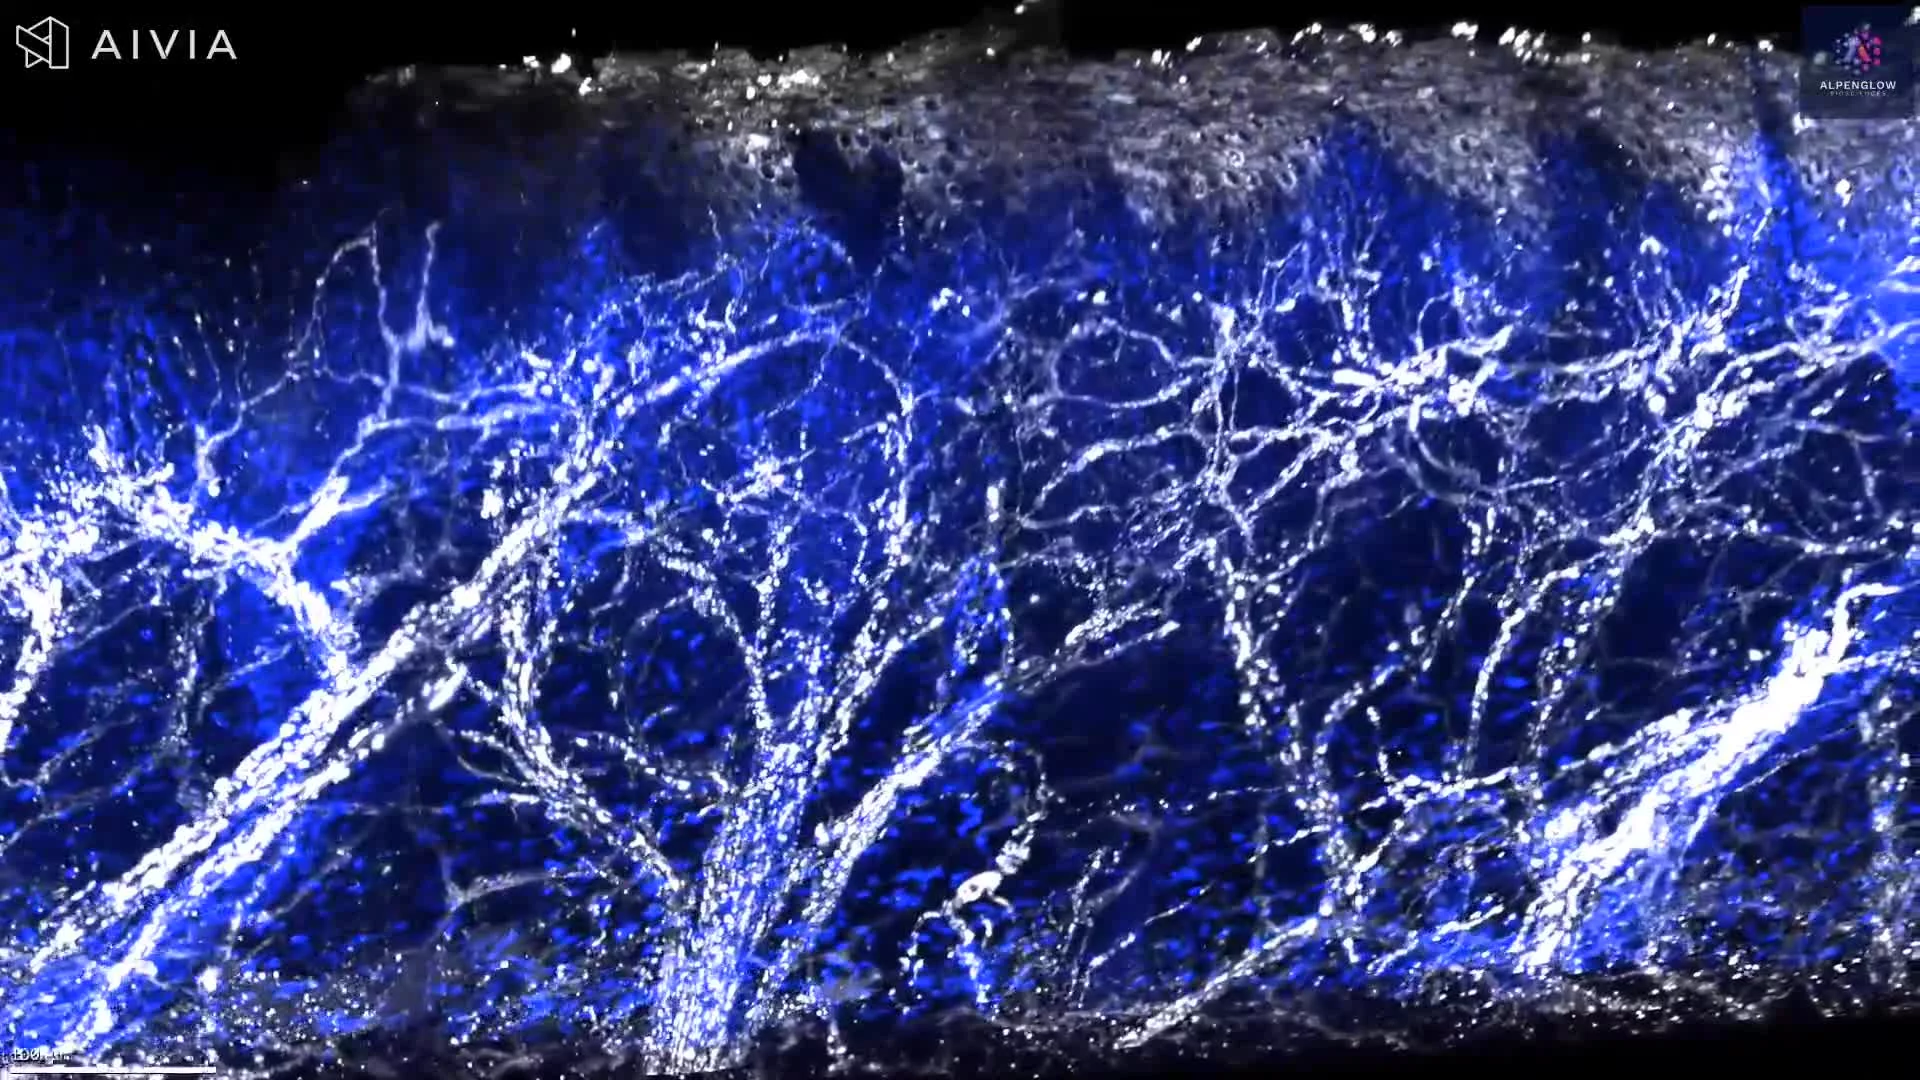
Volumetric 3D imaging of rat toe pad skin reveals cutaneous nerve fibers, branching, and terminal structures at the dermal–epidermal junction using PGP9.5 and YO-PRO-1 staining.
This dataset presents volumetric 3D imaging of rat toe pad skin, revealing cutaneous nerve architecture at the dermal–epidermal junction.
PGP9.5 highlights nerve fibers in white, while YO-PRO-1 labels nuclei in blue. The intact tissue volume preserves the continuity of larger nerve bundles, finer branches, fiber crossings, and terminal structures across tissue depth.
With appropriate segmentation, the dataset can support quantitative analysis of nerve density, fiber length, branching, orientation, and the distribution of nerve fibers relative to the epidermis and surrounding cells. These measurements are relevant to studies of cutaneous innervation, sensory biology, neuro-immune interactions, pain, itch, and disease-associated changes in nerve architecture.
The tissue was imaged using the Aurora 3D™ Spatial Biology Solution, including the 3Di™ Hybrid Open-Top Light-Sheet microscope.
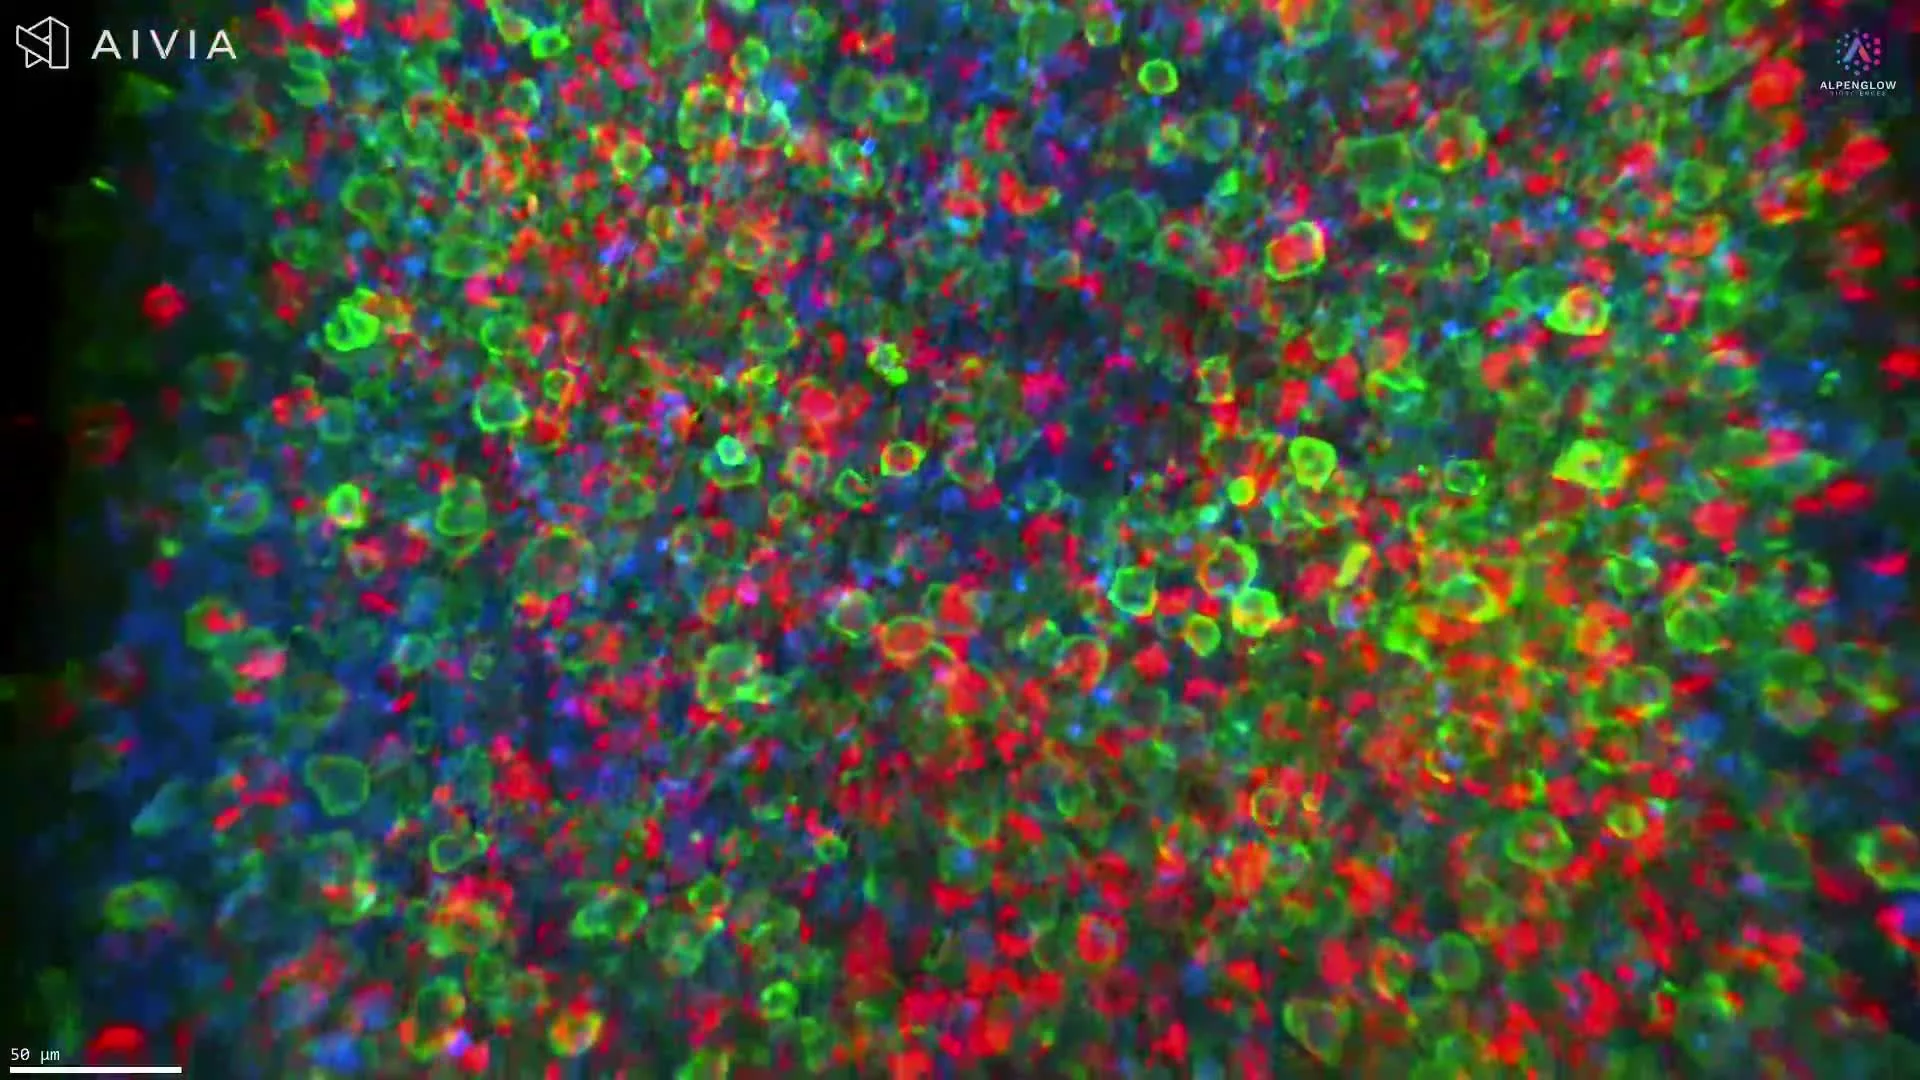
3D imaging of an intact mouse colorectal tumor reveals immune organization across the full tissue volume. B220-positive regions are shown in green, CD3-positive T cells in red, and nuclei in blue.
This video presents high-resolution 3D imaging of an intact mouse colorectal tumor, preserving immune organization across the full tissue volume.
B220, shown in green, highlights B-cell-rich regions. CD3, shown in red, identifies T-cell populations, while nuclei are shown in blue to provide cellular and tissue context. Together, these markers reveal how immune cells are distributed, clustered, and spatially organized within the tumor.
The volumetric dataset preserves regional heterogeneity and relationships between B-cell-rich and T-cell-rich areas across depth. With appropriate segmentation, it can support quantitative analysis of immune-cell density, clustering, spatial distribution, and distances between immune populations and surrounding tumor regions.
Explore how 3D tissue imaging supports immuno-oncology research across tumor architecture, immune-cell organization, and spatial relationships.
The tissue was imaged using the Aurora 3D™ Spatial Biology Solution, including the 3Di™ Hybrid Open-Top Light-Sheet microscope.
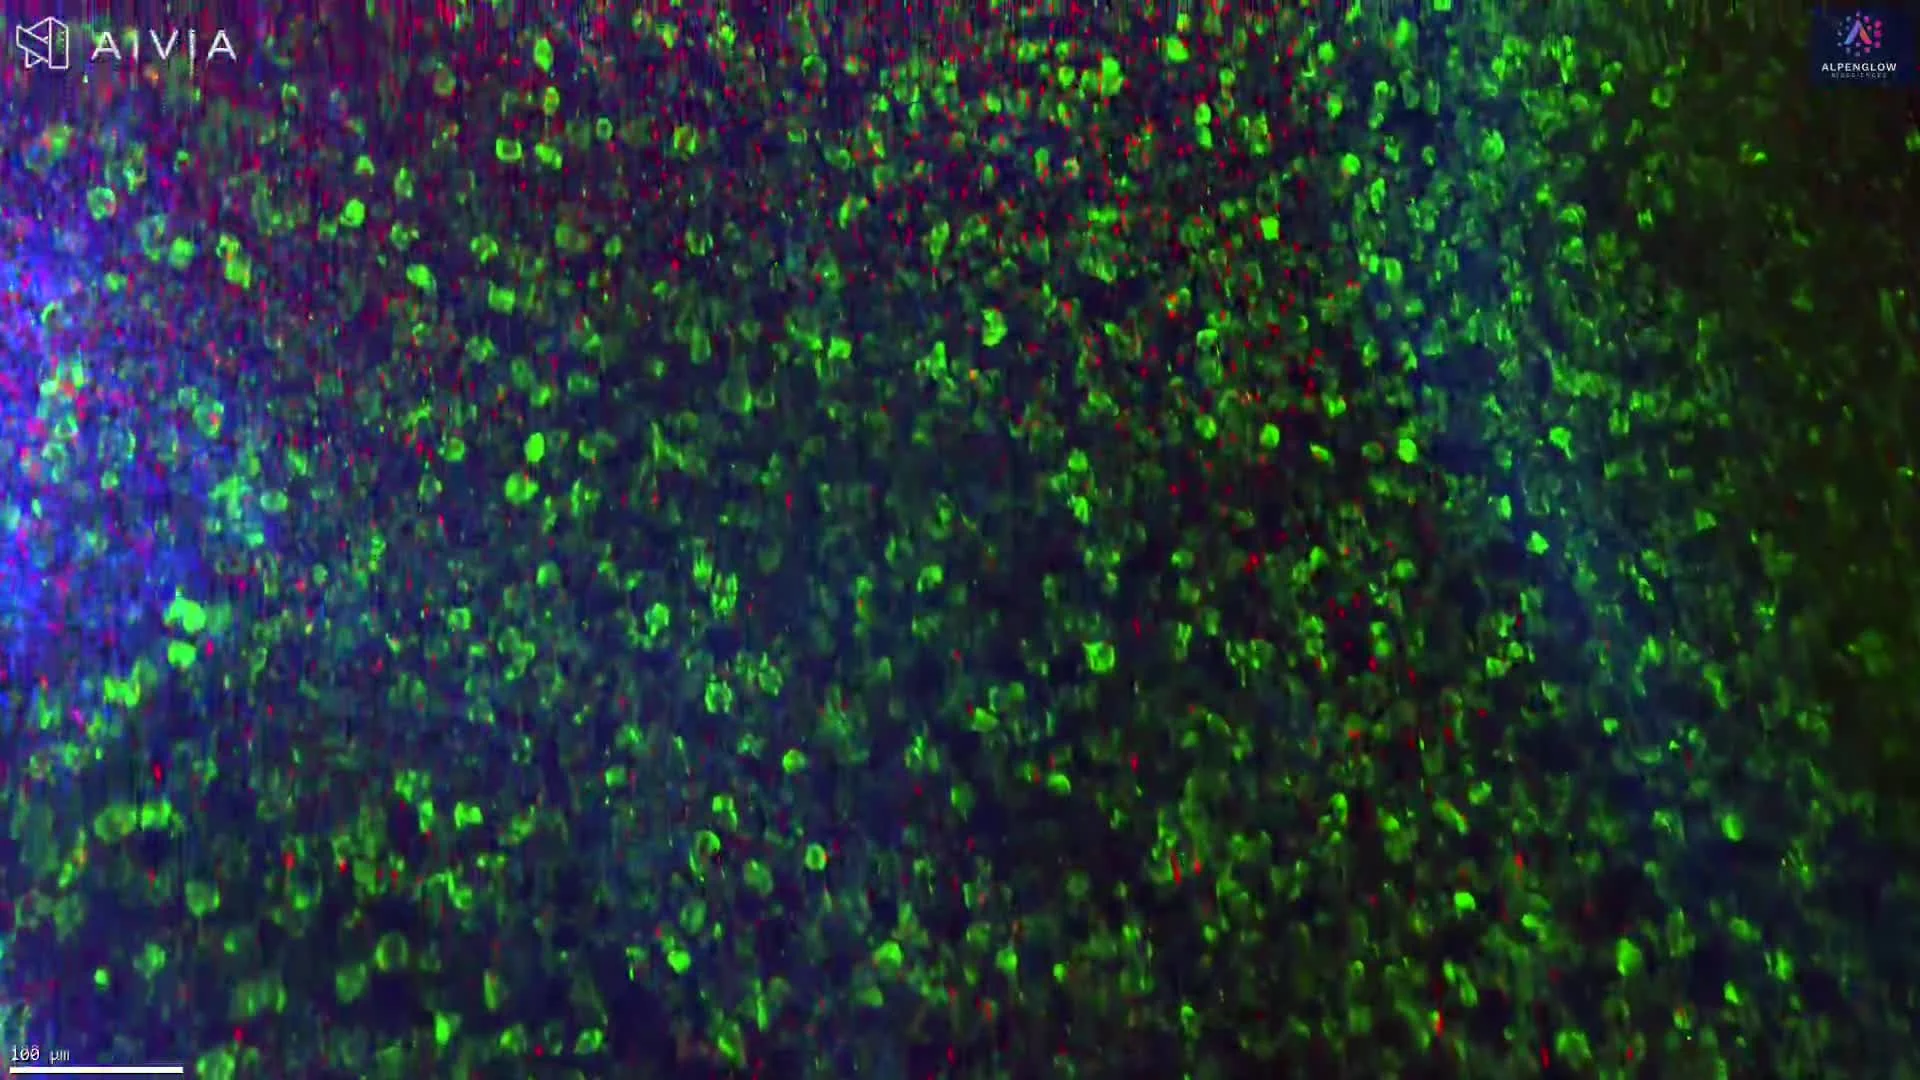
High-resolution 3D imaging of an intact mouse colorectal tumor reveals TLS-associated immune organization across tissue depth. B220-positive regions are shown in green, CD3-positive regions in magenta, and nuclei in blue.
This video presents high-resolution 3D imaging of an intact mouse colorectal tumor, revealing TLS-associated immune organization across the tissue volume.
B220, shown in green, highlights B-cell-rich regions. CD3, shown in magenta, identifies T-cell-rich regions, while nuclei are shown in blue to provide cellular and tissue context. Together, these markers reveal the spatial arrangement of B- and T-cell populations within organized immune aggregates.
The workflow begins with volumetric screening of the cleared tumor to identify regions containing dense B220 and CD3 signal. Selected regions are then imaged at higher resolution, preserving their position within the surrounding tumor while revealing cellular organization in greater detail.
With appropriate segmentation and validated TLS criteria, the dataset can support analysis of aggregate numbers, volume, distribution, cellular organization, and spatial relationships with surrounding tumor regions.
Explore how 3D tissue imaging supports immuno-oncology research across tumor architecture, immune-cell organization, and spatial relationships.
The tissue was imaged using the Aurora 3D™ Spatial Biology Solution, including the 3Di™ Hybrid Open-Top Light-Sheet microscope.
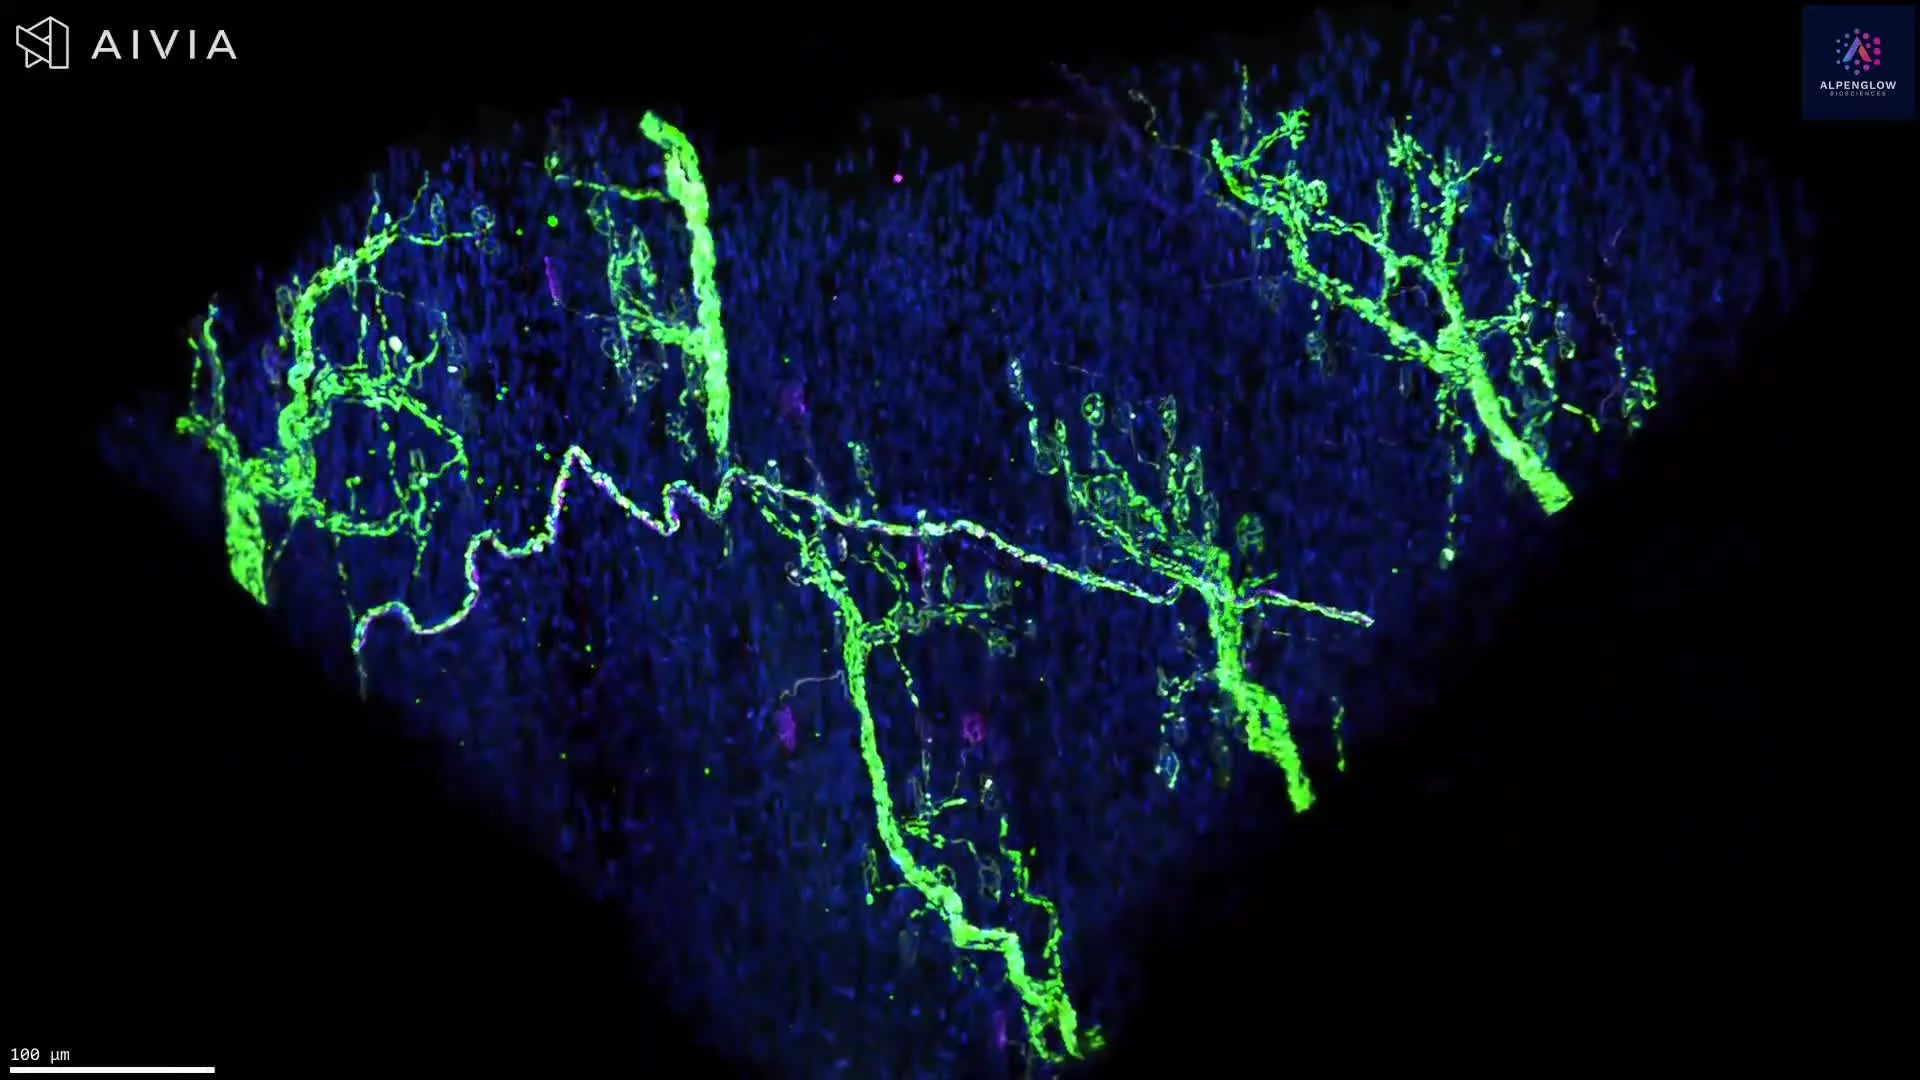
Volumetric 3D imaging of mouse skeletal muscle reveals axonal trajectories and branching across tissue depth. NF200 highlights larger-caliber nerve fibers, PGP9.5 visualizes the broader neuronal network, and YO-PRO-1 labels nuclei.
This dataset presents volumetric 3D imaging of mouse skeletal muscle stained with NF200, PGP9.5, and YO-PRO-1.
NF200, shown in green, highlights neurofilament heavy chain in larger-caliber axons and reveals major neural trajectories. PGP9.5, shown in magenta, visualizes the broader axonal network throughout the muscle. YO-PRO-1, shown in blue, labels nuclei and provides cellular context across the tissue volume.
The 3D view preserves axonal trajectories, branching patterns, and regional innervation across depth. With appropriate segmentation, the dataset can support measurements of axon length, branching complexity, regional nerve density, orientation, and spatial distribution.
Explore how 3D tissue imaging supports dermatology research across skin architecture, innervation, immune organization, and spatial relationships.
The tissue was imaged using the Aurora 3D™ Spatial Biology Solution, including the 3Di™ Hybrid Open-Top Light-Sheet microscope.
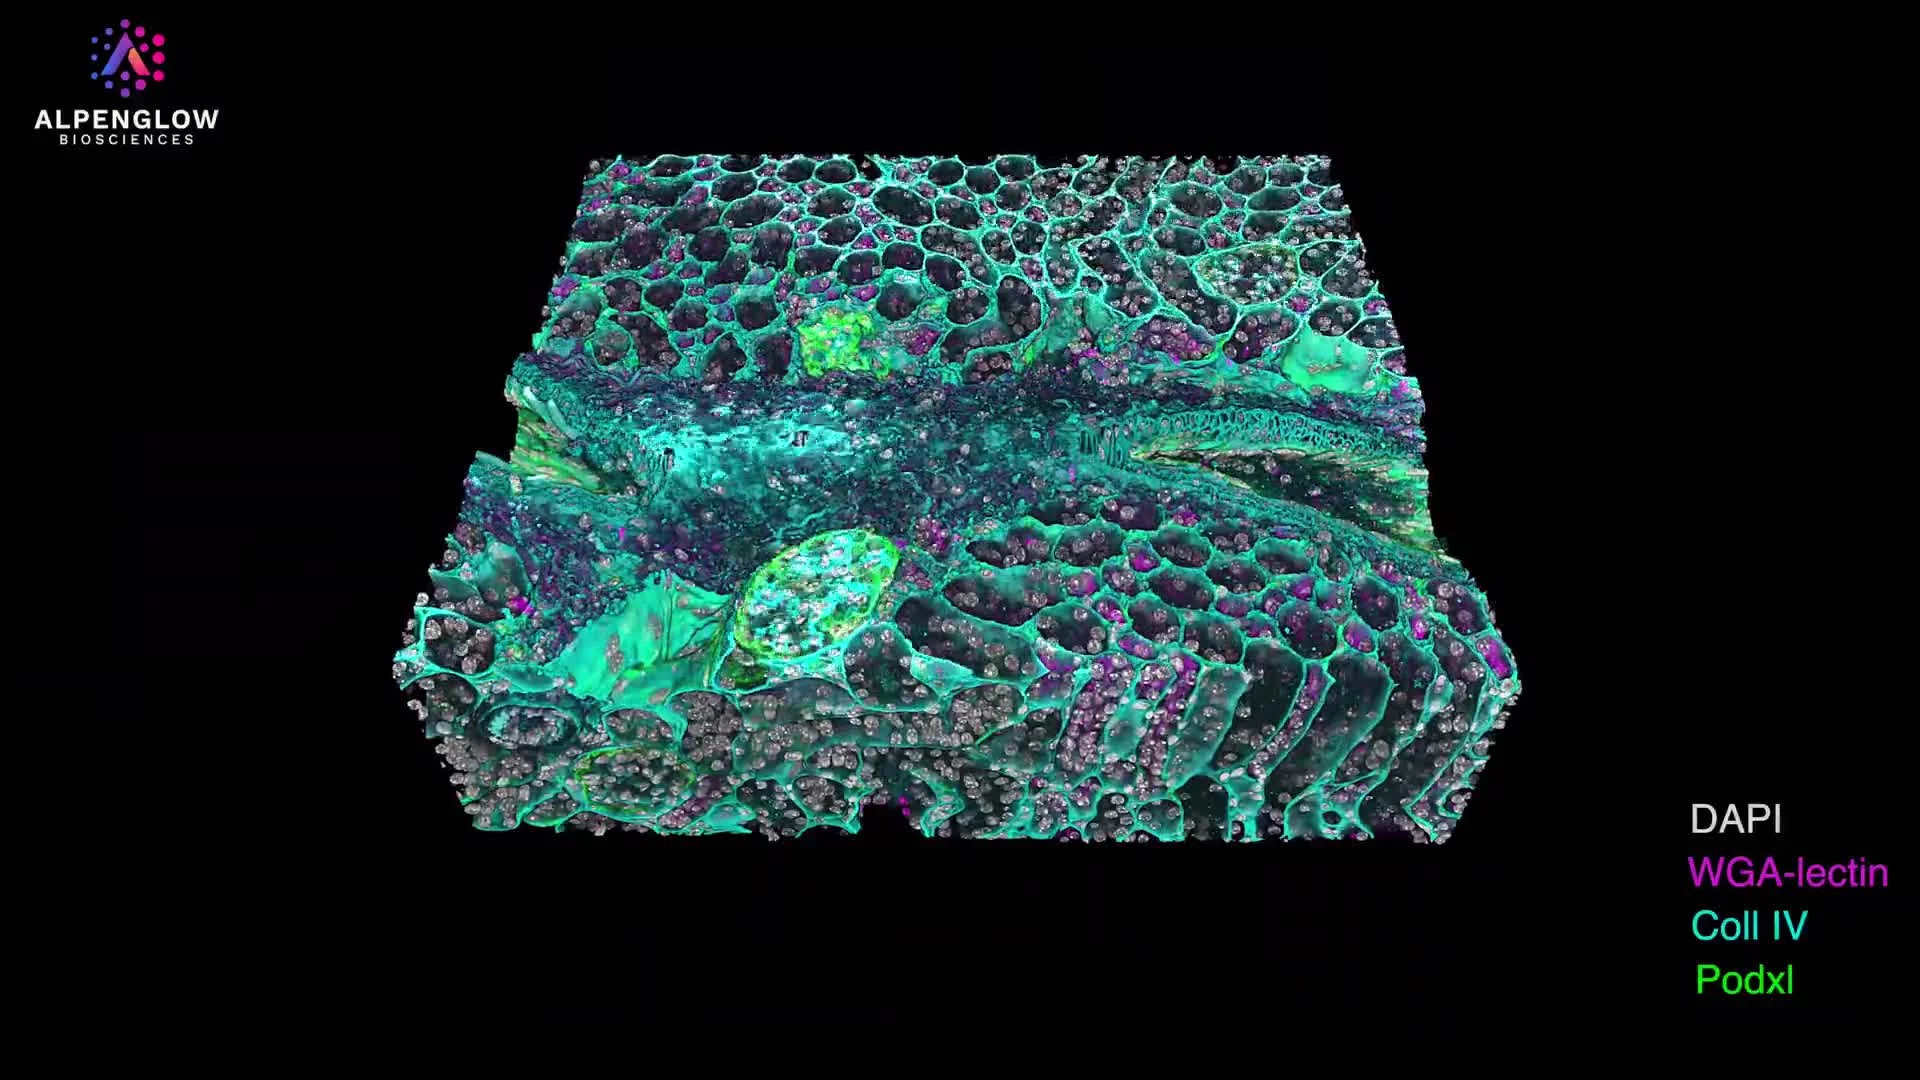
Expanded 3D imaging of mouse kidney tissue reveals glomerular and basement membrane architecture across an intact volume.
This video presents expanded 3D imaging of mouse kidney tissue, revealing glomerular, basement membrane, and extracellular matrix architecture across an intact tissue volume.
Nuclei are shown in white. Collagen IV, shown in blue, highlights basement membrane structures. WGA lectin, shown in magenta, labels glycoprotein-rich tissue features, while podocalyxin, shown in green, highlights podocyte-associated structures within the glomeruli.
Expansion microscopy physically enlarges the specimen, increasing the separation between fluorescently labeled structures while preserving their relative spatial organization. Traversing the expanded volume reveals the three-dimensional relationships among glomeruli, basement membranes, and surrounding renal tissue that can appear fragmented in individual 2D sections.
The dataset can support analysis of glomerular morphology, basement membrane organization, spatial distribution, and structural variation across the imaged kidney volume.
This work was performed in collaboration with Joshua Vaughan and the University of Washington Department of Chemistry.
The tissue was imaged using the Aurora 3D™ Spatial Biology Solution, including the 3Di™ Hybrid Open-Top Light-Sheet microscope.
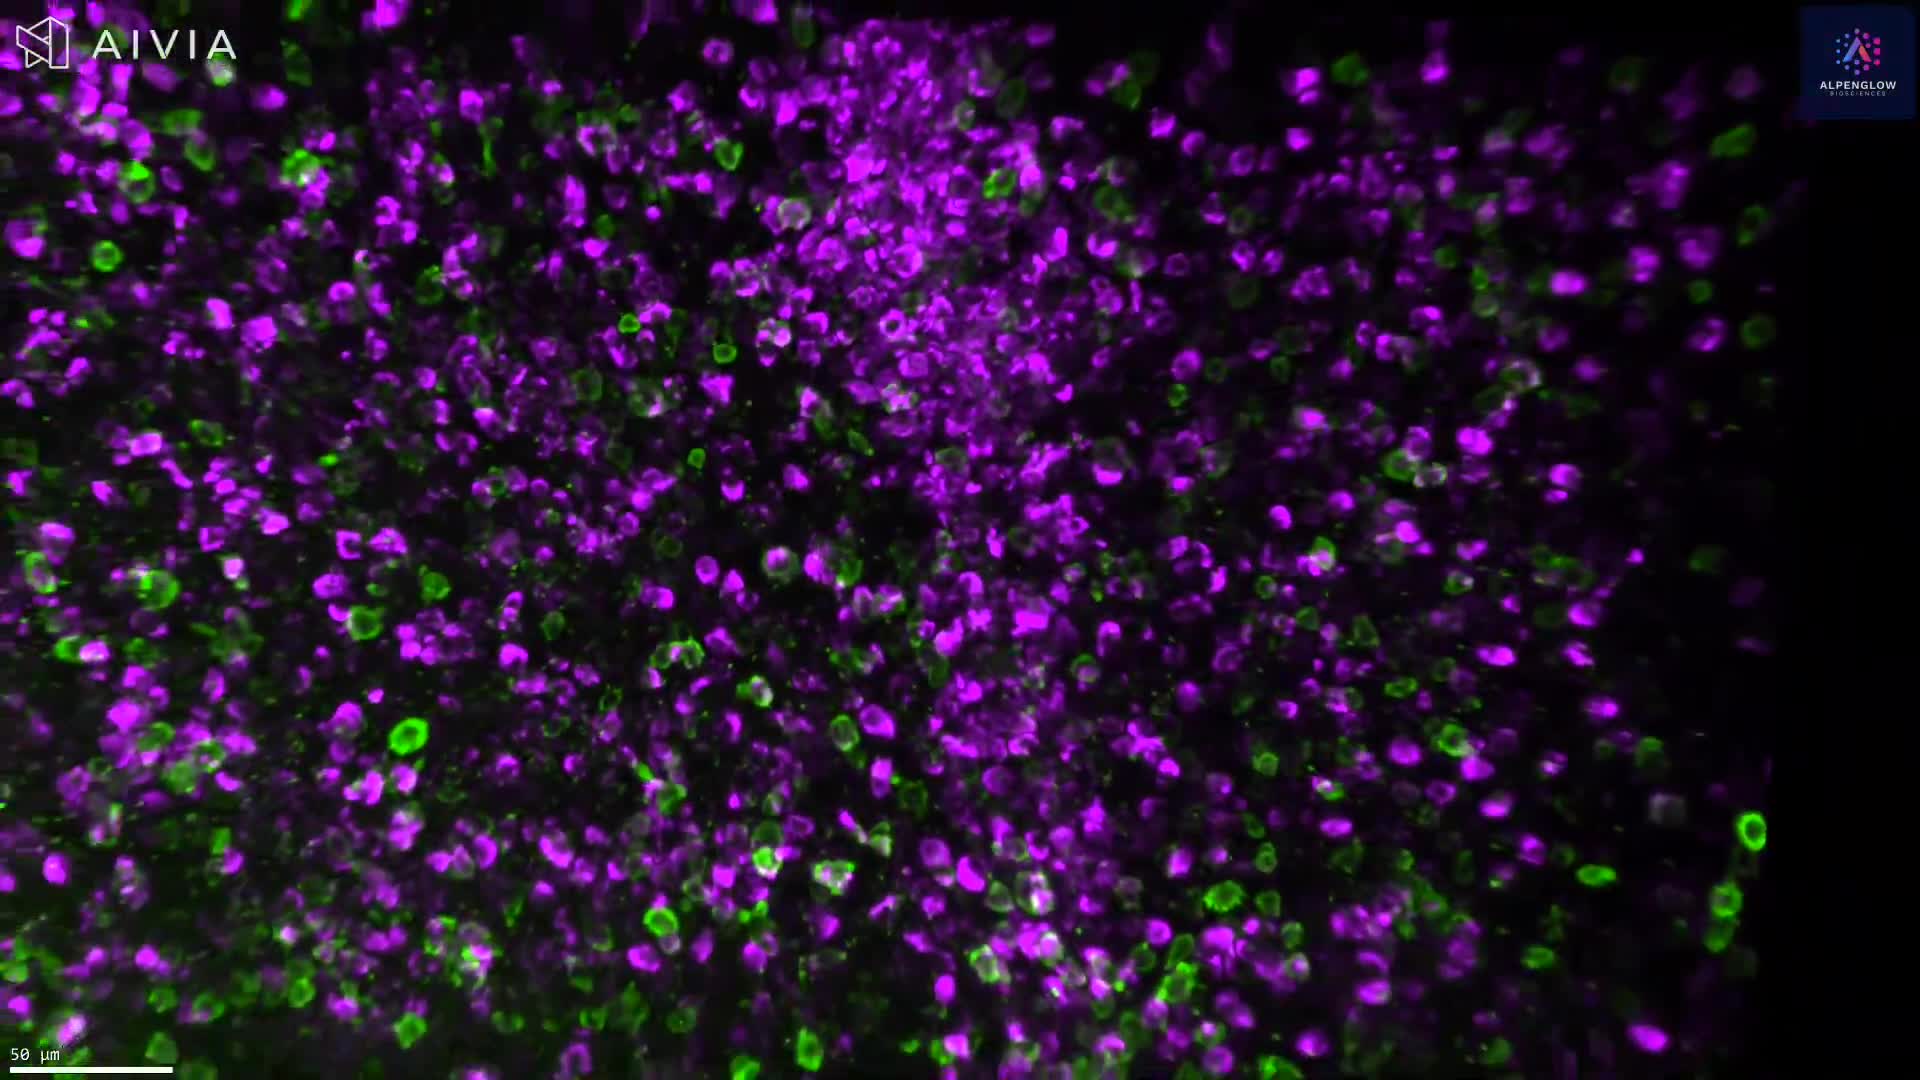
3D light-sheet imaging of an intact mouse colorectal tumor maps B220-positive B-cell populations in green and CD3-positive T-cell populations in magenta, preserving cellular organization across the full tissue depth.
This video presents 3D tissue imaging of an intact mouse colorectal tumor using light-sheet fluorescence microscopy.
B220, shown in green, highlights B-cell populations, while CD3, shown in magenta, identifies T-cell populations. Individual labeled cells can be resolved while their positions remain connected to the surrounding tumor architecture.
The volumetric view reveals differences in immune cell density, clustering, and spatial distribution throughout the tumor. Unlike measurements based on selected tissue sections, imaging the intact volume preserves immune organization across depth and supports analysis from cellular detail to tissue-scale patterns.
With appropriate segmentation, the dataset can support quantitative analysis of B220-positive and CD3-positive cell densities, clustering, regional distributions, and spatial relationships among immune populations. Organized immune aggregates can also be located for further characterization using additional markers and validated tertiary lymphoid structure criteria.
Explore how 3D tissue imaging supports immuno-oncology research across tumor architecture, immune-cell organization, and spatial relationships.
The tissue was imaged using the Aurora 3D™ Spatial Biology Solution, including the 3Di™ Hybrid Open-Top Light-Sheet microscope.
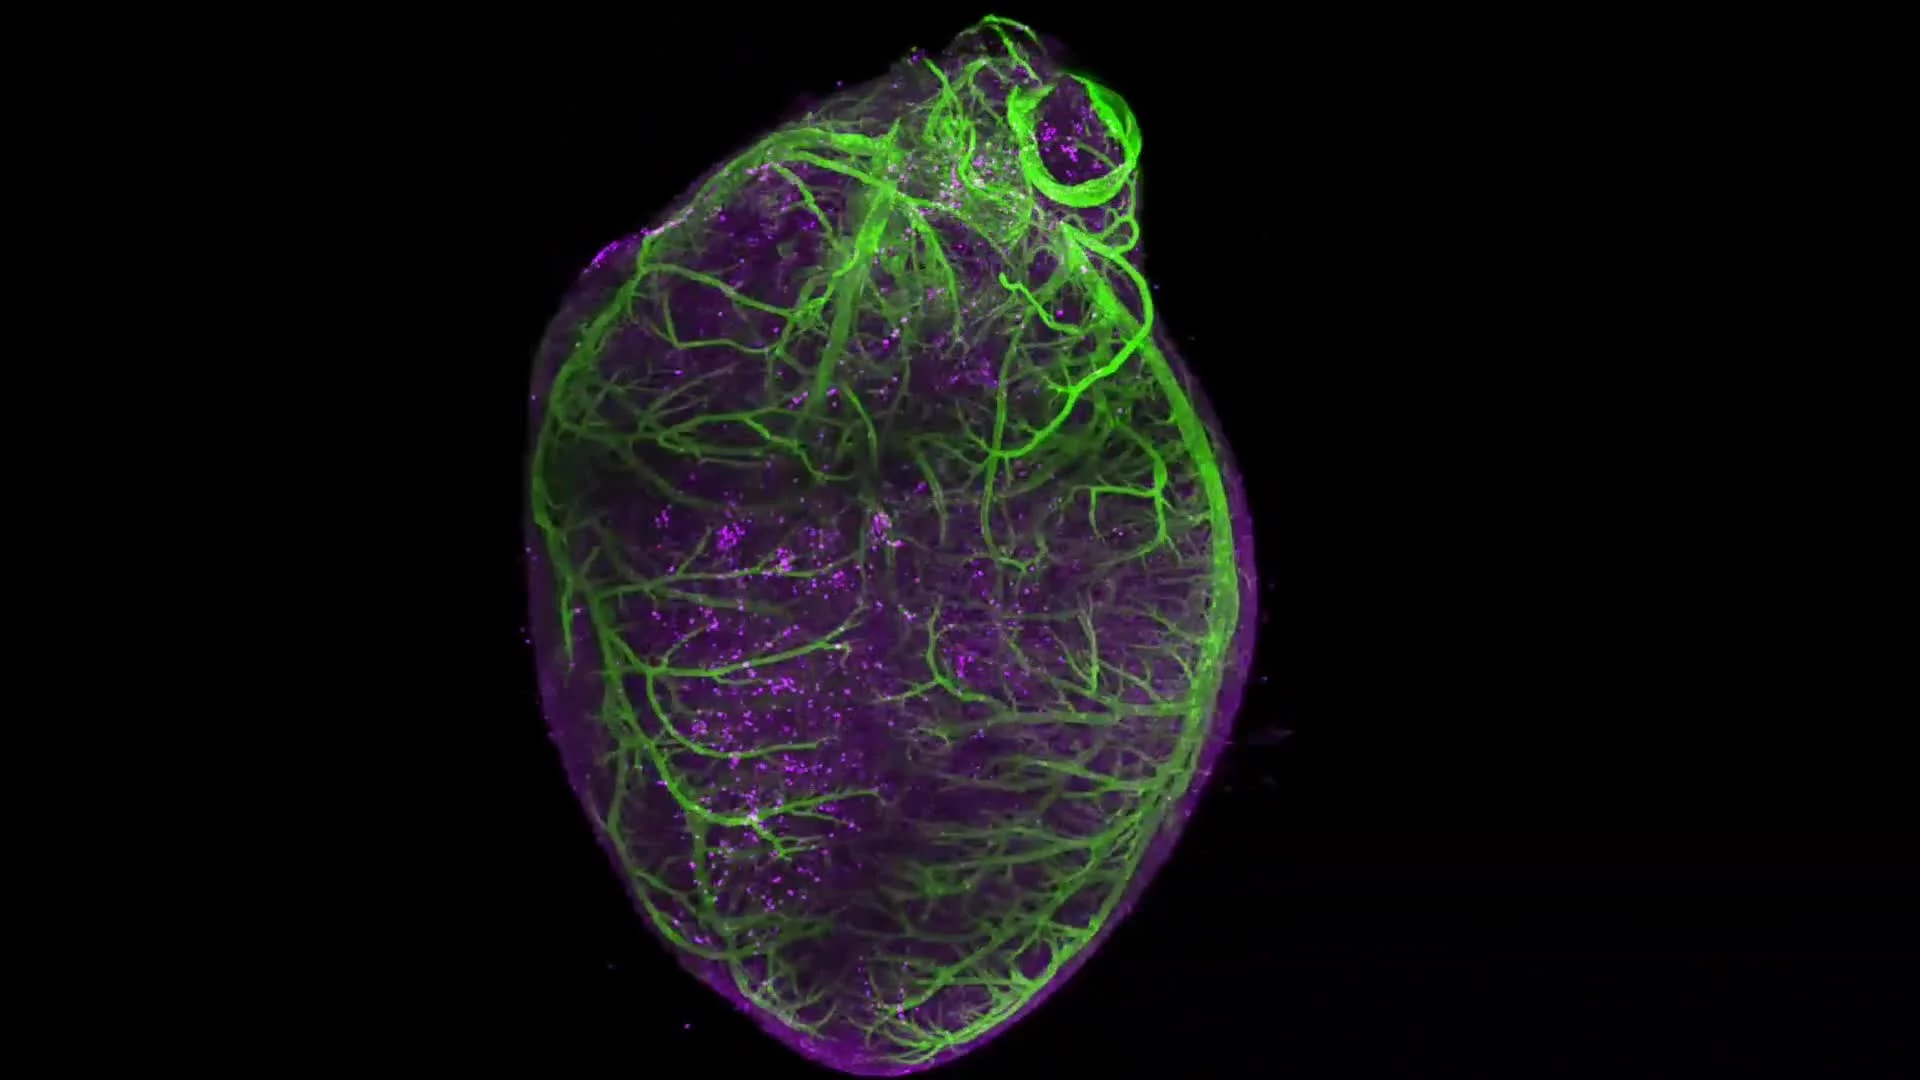
Whole-organ 3D imaging of a murine heart combines Scout and high-resolution Zoom imaging to reveal vascular branching and vessel-associated mural cell organization across scales.
This dataset presents a whole murine heart imaged in 3D, preserving vascular and vessel-associated cellular architecture across the intact organ.
Smooth muscle actin, shown in green, highlights SMA-positive structures associated with the vasculature. A mural-cell-associated signal, shown in purple, reveals vessel-associated cells along the vascular network.
The video begins with larger vessels and progressively moves into selected regions, combining Scout imaging of the whole organ with high-resolution Zoom imaging of local vascular structures. This multiscale view reveals vessel branching and the organization of mural cells around vessels, including fine perivascular structures at cellular detail.
The dataset supports quantitative analysis of vessel density, branching, diameter, tortuosity, mural-cell distribution, and spatial proximity between vessel-associated cells and the vascular wall. These measurements are relevant to cardiovascular research, vascular biology, tissue remodeling, and preclinical studies of disease and treatment response.
The tissue was imaged using the Aurora 3D™ Spatial Biology Solution, including the 3Di™ Hybrid Open-Top Light-Sheet microscope.
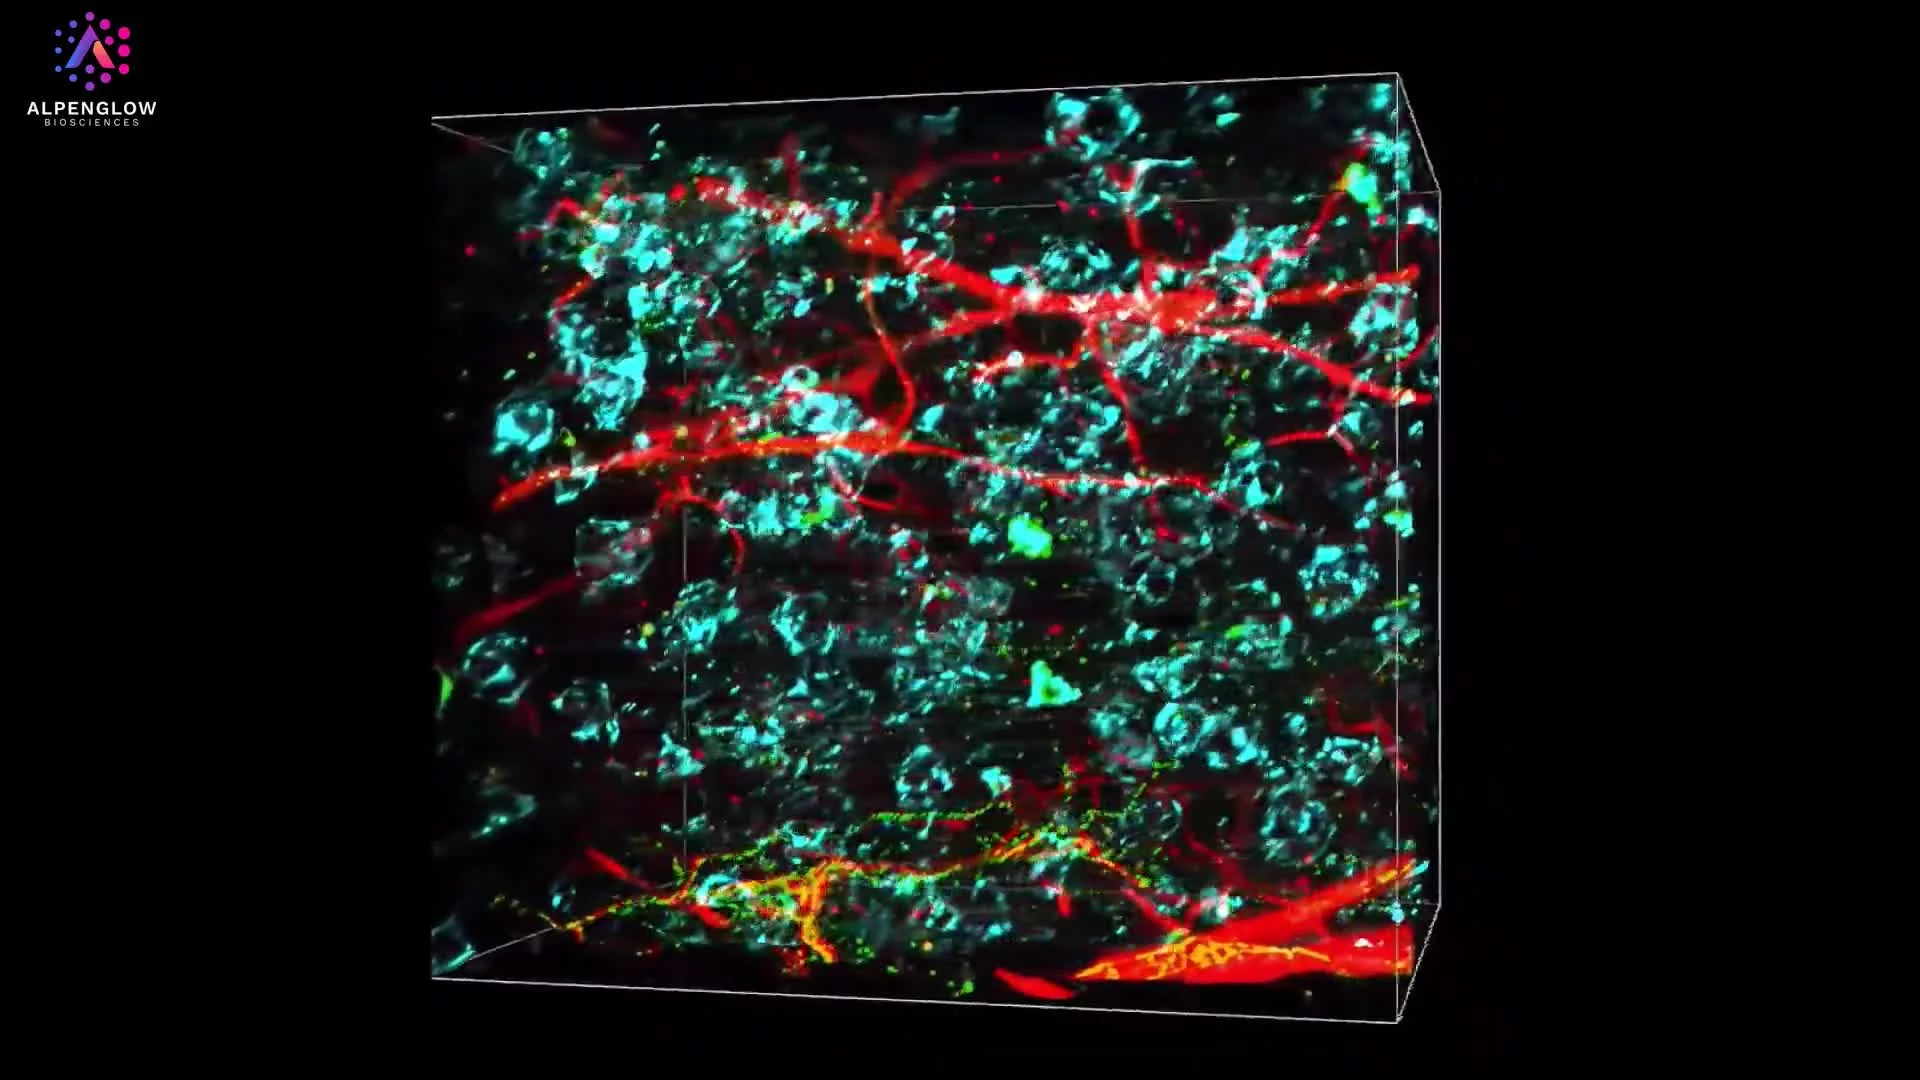
3D imaging of cleared mouse fat pad reveals blood vessels, macrophages, and nerves labeled with lectin, CD68, and PGP9.5.
This dataset presents a cleared, triple-labeled mouse fat pad imaged in 3D, preserving vascular, immune, and neural structures across the intact tissue volume.
Lectin, shown in red, highlights the vascular network. CD68, shown in turquoise, identifies macrophage-associated cells, while PGP9.5, shown in green, traces nerve fibers throughout the adipose tissue.
The volumetric view reveals the distribution and spatial relationships of blood vessels, CD68-positive cells, and nerves within the surrounding tissue architecture. Preserving these structures across depth enables investigation of immune–neural–vascular organization that can be fragmented or missed in selected 2D sections.
The dataset supports quantitative analysis of vascular density and branching, nerve density and trajectory, CD68-positive cell distribution, and distances among immune, vascular, and neural structures. These measurements are relevant to preclinical studies of adipose tissue biology, inflammation, remodeling, metabolism, and neurovascular organization.
The tissue was imaged using the Aurora 3D™ Spatial Biology Solution, including the 3Di™ Hybrid Open-Top Light-Sheet microscope.
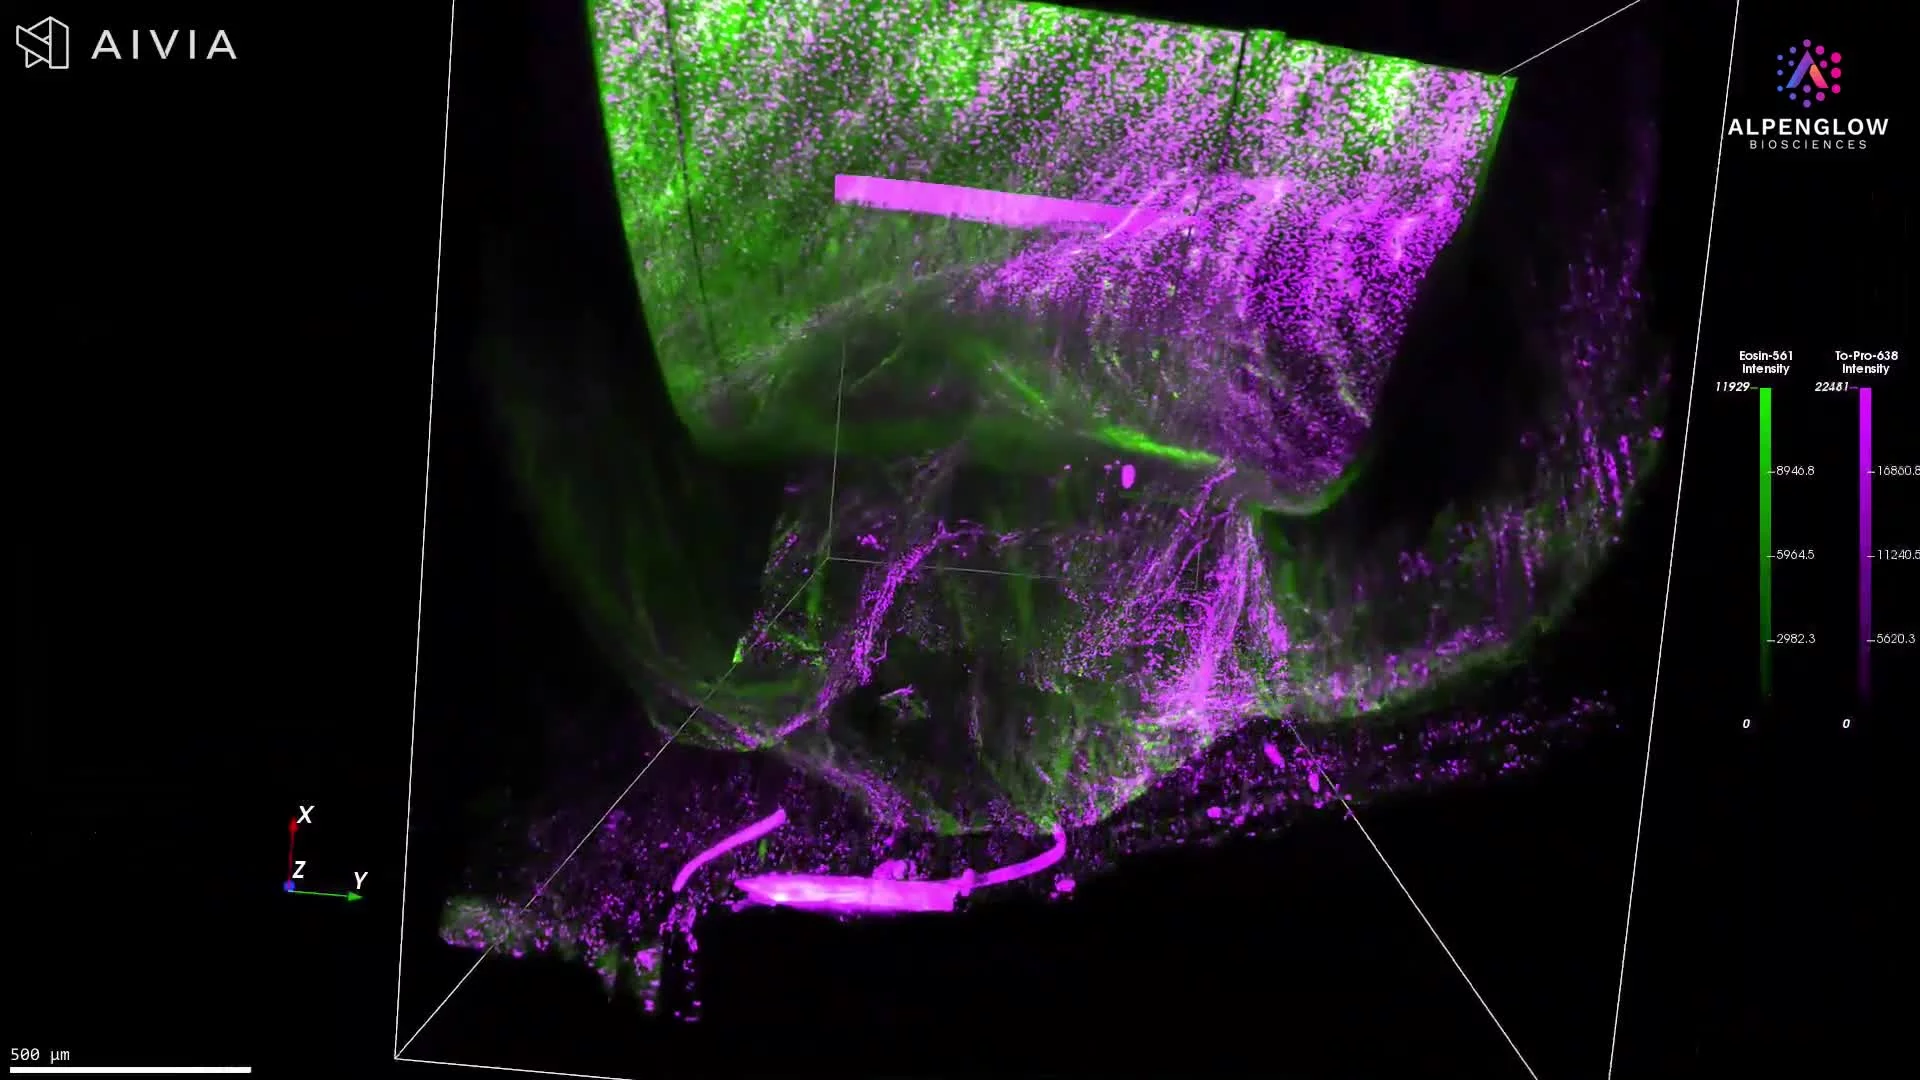
High-resolution 3D imaging of a cleared rabbit retina stained with TO-PRO-3 and eosin, preserving architecture across retinal, choroid, and scleral layers.
This dataset presents a high-resolution 3D visualization of a cleared rabbit retina, captured intact on the Aurora™ 3Di Hybrid Open Top Light Sheet (HOTLS) microscope. By avoiding physical sectioning, the imaging preserves the true spatial architecture of the tissue.
Stains used:
TO-PRO-3 (Magenta, pseudocolor): Labels nuclei
Eosin (Green, pseudocolor): Highlights cytoplasmic structures
The fly-through reveals the full thickness of the sample (≈1 × 1 × 4 mm), capturing the retina, choroid, and sclera in their native spatial organization. This volumetric dataset enables accurate morphological and contextual analysis at cellular resolution, overcoming the limitations of 2D histology.
When combined with 3Dm data management and 3Dai AI-powered segmentation, the dataset can be further analyzed for nuclear density, layer-specific organization, and cellular distribution. Applications include ophthalmology research, retinal disease modeling, and translational studies focused on vision science.
From vasculature to single cells, 3D light-sheet imaging reveals the intricate architecture of a whole mouse brain in unparalleled detail.
This dataset showcases 3D light-sheet imaging of a whole mouse brain, captured with the Aurora™ 3Di Hybrid Open Top Light Sheet (HOTLS) microscope. From organ-level vasculature down to single-cell resolution, the imaging reveals the full intricacy of brain architecture across every layer.
The dataset highlights how volumetric imaging preserves intact morphology, making it possible to study neuronal networks, vascular pathways, and cellular organization without the distortions of traditional 2D histology.
Complete visualization of neuronal and vascular networks across the brain
Cellular context preserved in full volumetric detail
Accurate mapping of tissue complexity that 2D slices cannot replicate
This dataset connects directly to the Nature Methods paper presenting our light-sheet microscope: Read the paper.
By combining 3Dm data management with 3Dai AI-powered segmentation, researchers can extend these visuals into actionable analyses, from neuronal density measurements to vascular branching and spatial profiling.
Applications include neuroscience research, brain mapping, and studies of neurodegenerative diseases, where understanding tissue complexity in situ is critical.
Built for shared imaging environments
Support more users, samples, and imaging questions
Give researchers access to whole-sample overview imaging and high-resolution interrogation within one workflow. Flexible sample access and guided acquisition help core teams support varied projects without building a separate process for every use case.
Accommodate diverse sample formats
Support projects ranging from organoids and tissue sections to large cleared specimens through an open-top design and extended working distance.
Move efficiently from Scout to Zoom
Capture a rapid whole-sample overview, identify regions of interest, and return to selected areas for higher-resolution imaging without transferring the specimen between systems.
Standardize acquisition across users
Use a guided microscope interface and repeatable acquisition workflows to help facility staff train users and generate consistent volumetric datasets across studies.
Broaden the facility’s scientific reach
Extend core capabilities across organoid research, immunology, oncology, fibrosis, vascular biology, neuroscience, and preclinical tissue studies.
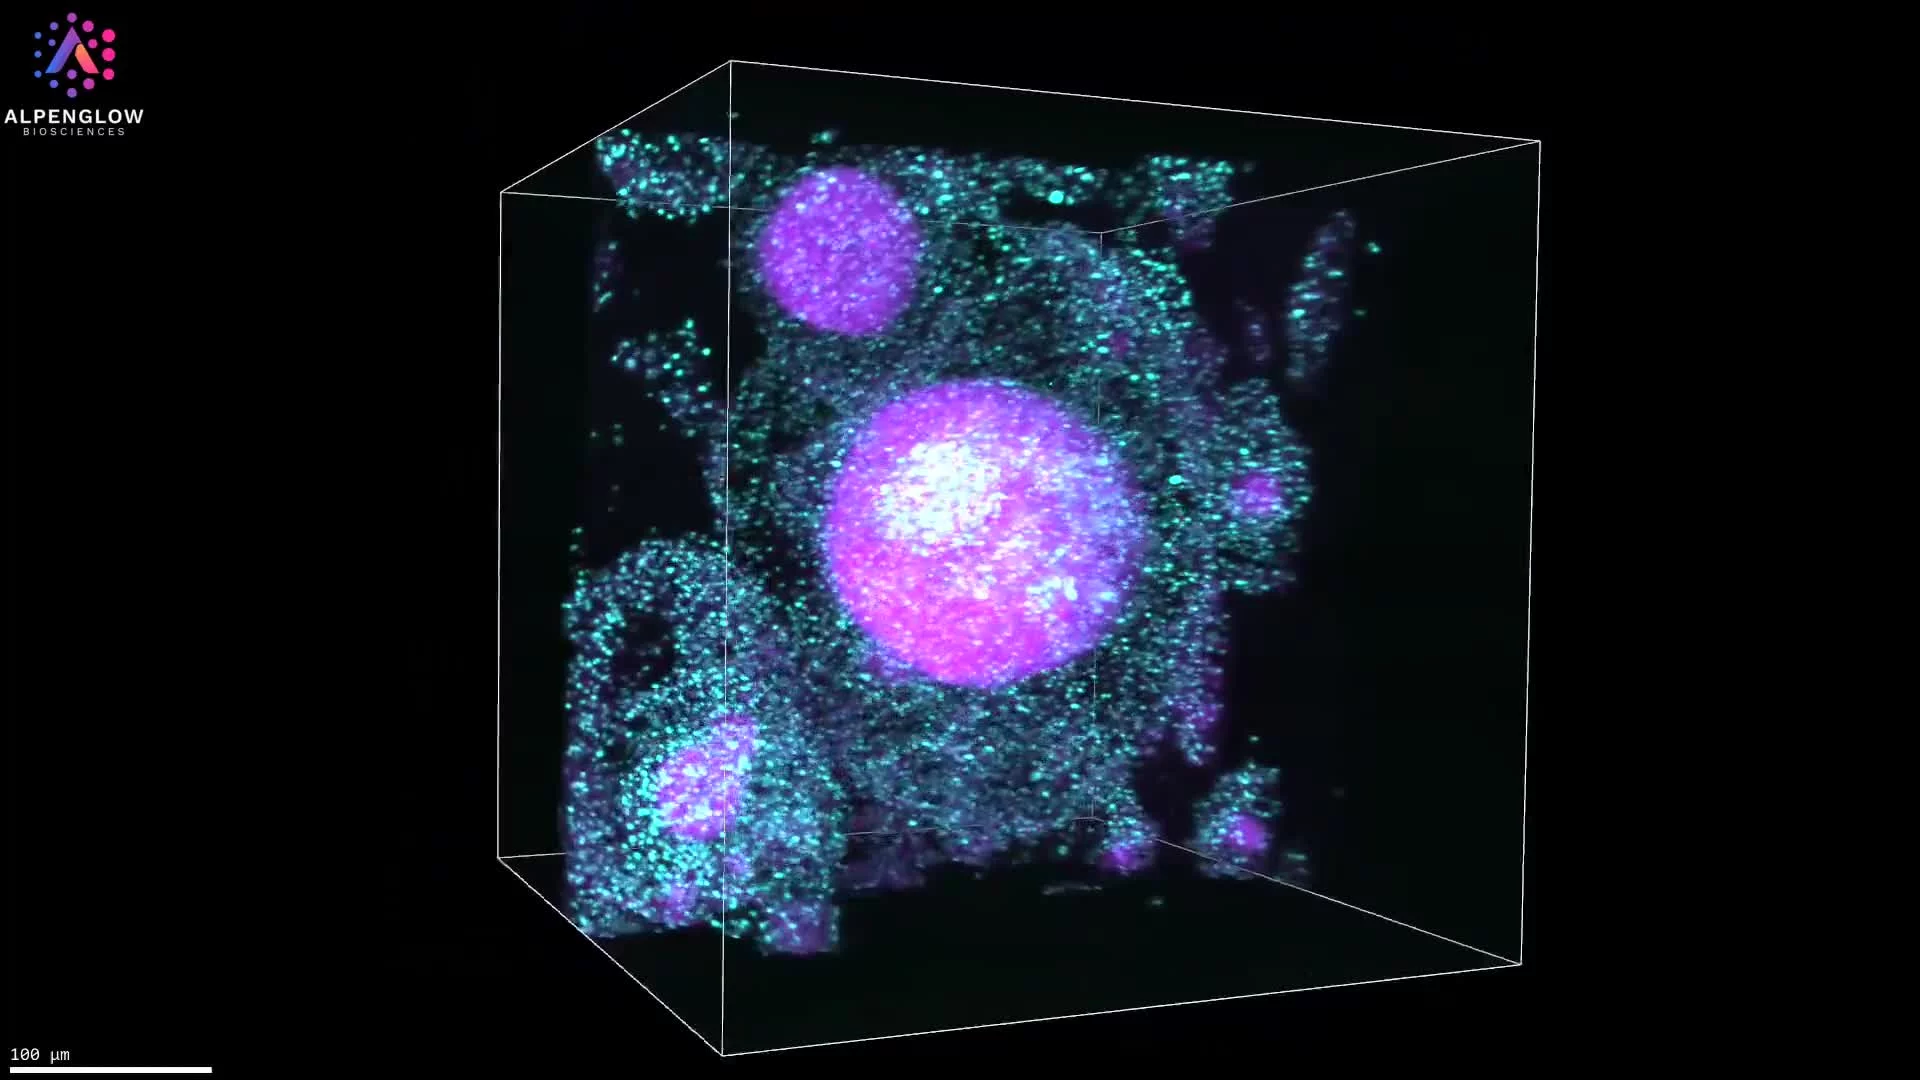
3D imaging of prostate organoids stained with TO-PRO-3 and eosin reveals spatial heterogeneity, cellular interactions, and microenvironmental detail.
At the frontier of cellular research, three-dimensional fluorescence imaging is redefining how scientists study prostate organoids. Unlike traditional 2D microscopy, which flattens complex structures, 3D imaging preserves the full architecture of these miniature organs, exposing biological subtleties that thin slices overlook.
Stains used:
TO-PRO-3: Highlights nuclei
Eosin: Labels cytoplasmic structures (pseudocolored for enhanced detail)
Using the Aurora™ 3Di Hybrid Open Top Light Sheet (HOTLS) microscope, organoids are imaged layer by layer, generating vivid, information-rich datasets. With integration into 3Dm data management and 3Dai AI-powered segmentation, researchers can quantify nuclear organization, cytoplasmic morphology, and spatial heterogeneity across entire organoids.
This volumetric approach provides unmatched clarity into cellular interactions, microenvironmental gradients, and spatial variability, offering transformative insights for prostate cancer modeling, drug testing, and precision medicine.
By moving beyond 2D limitations, 3D digital pathology empowers organoid studies with true biological context.
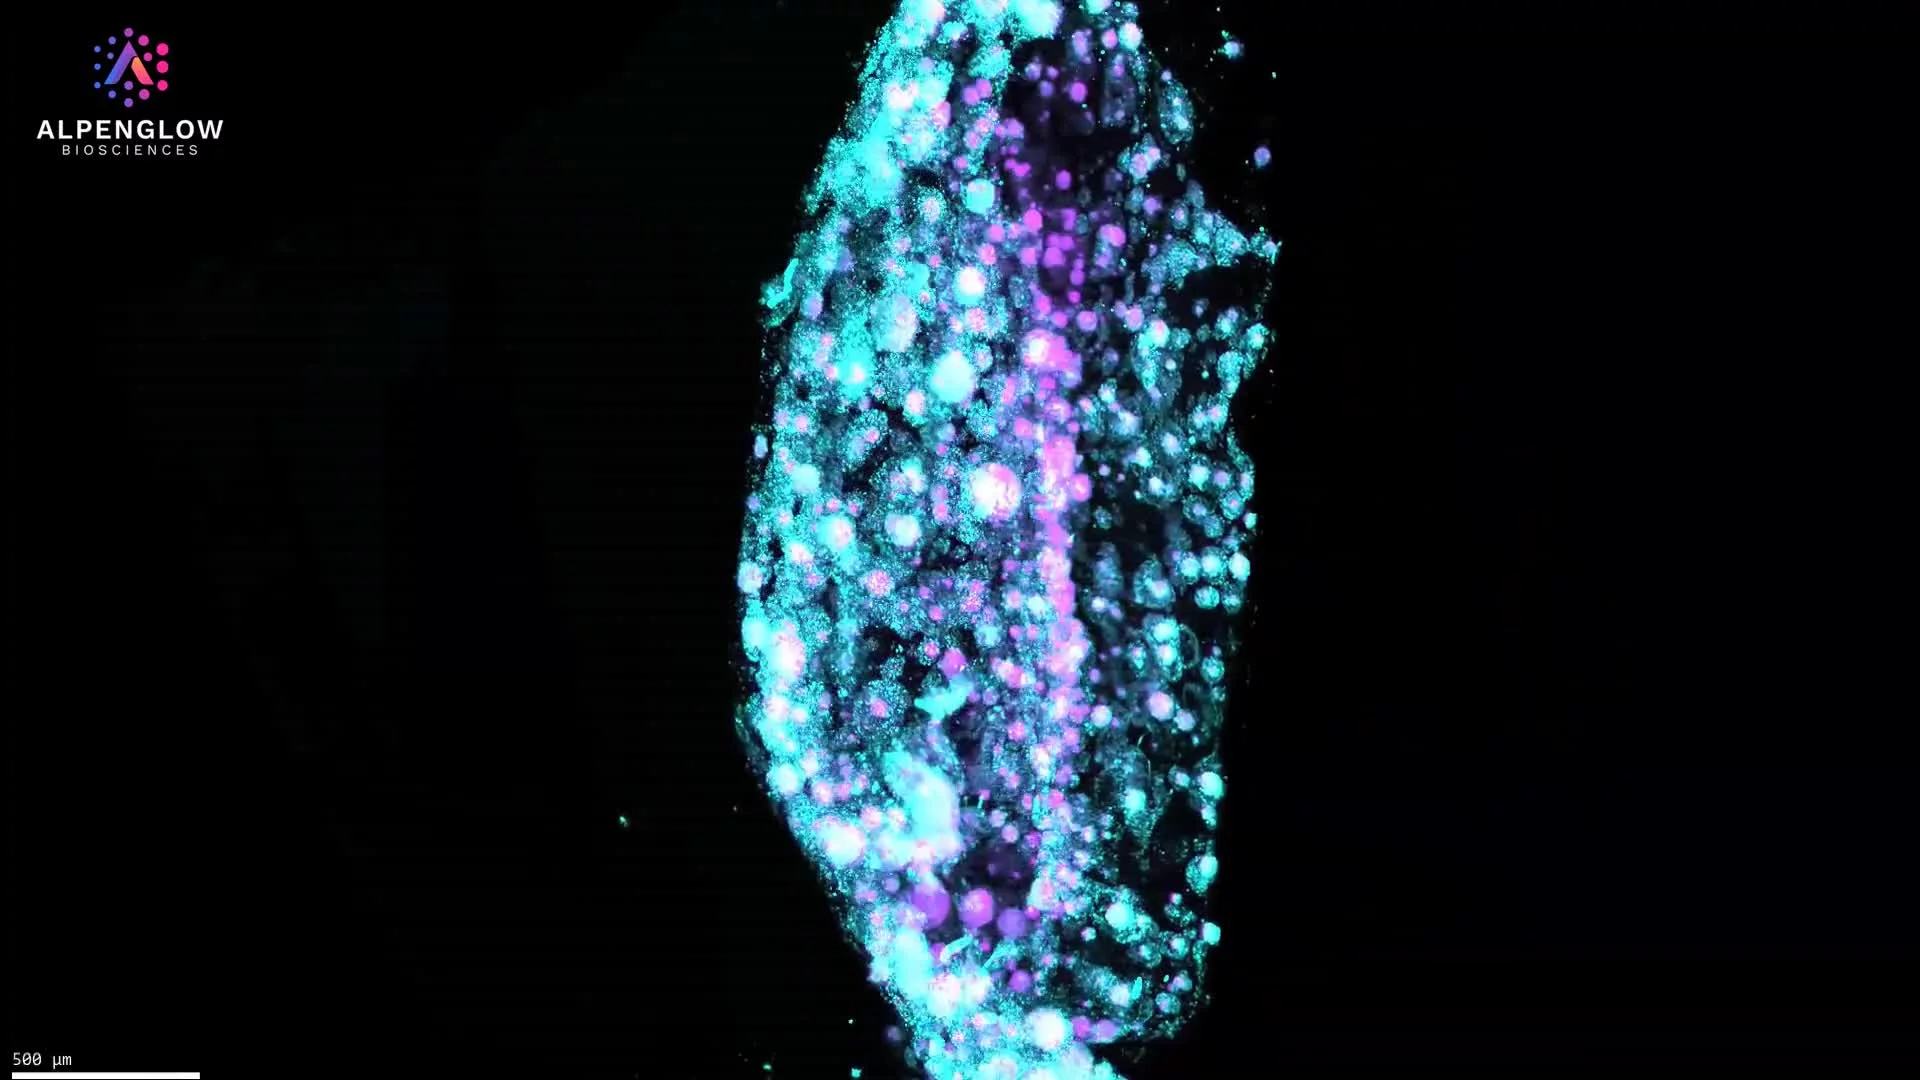
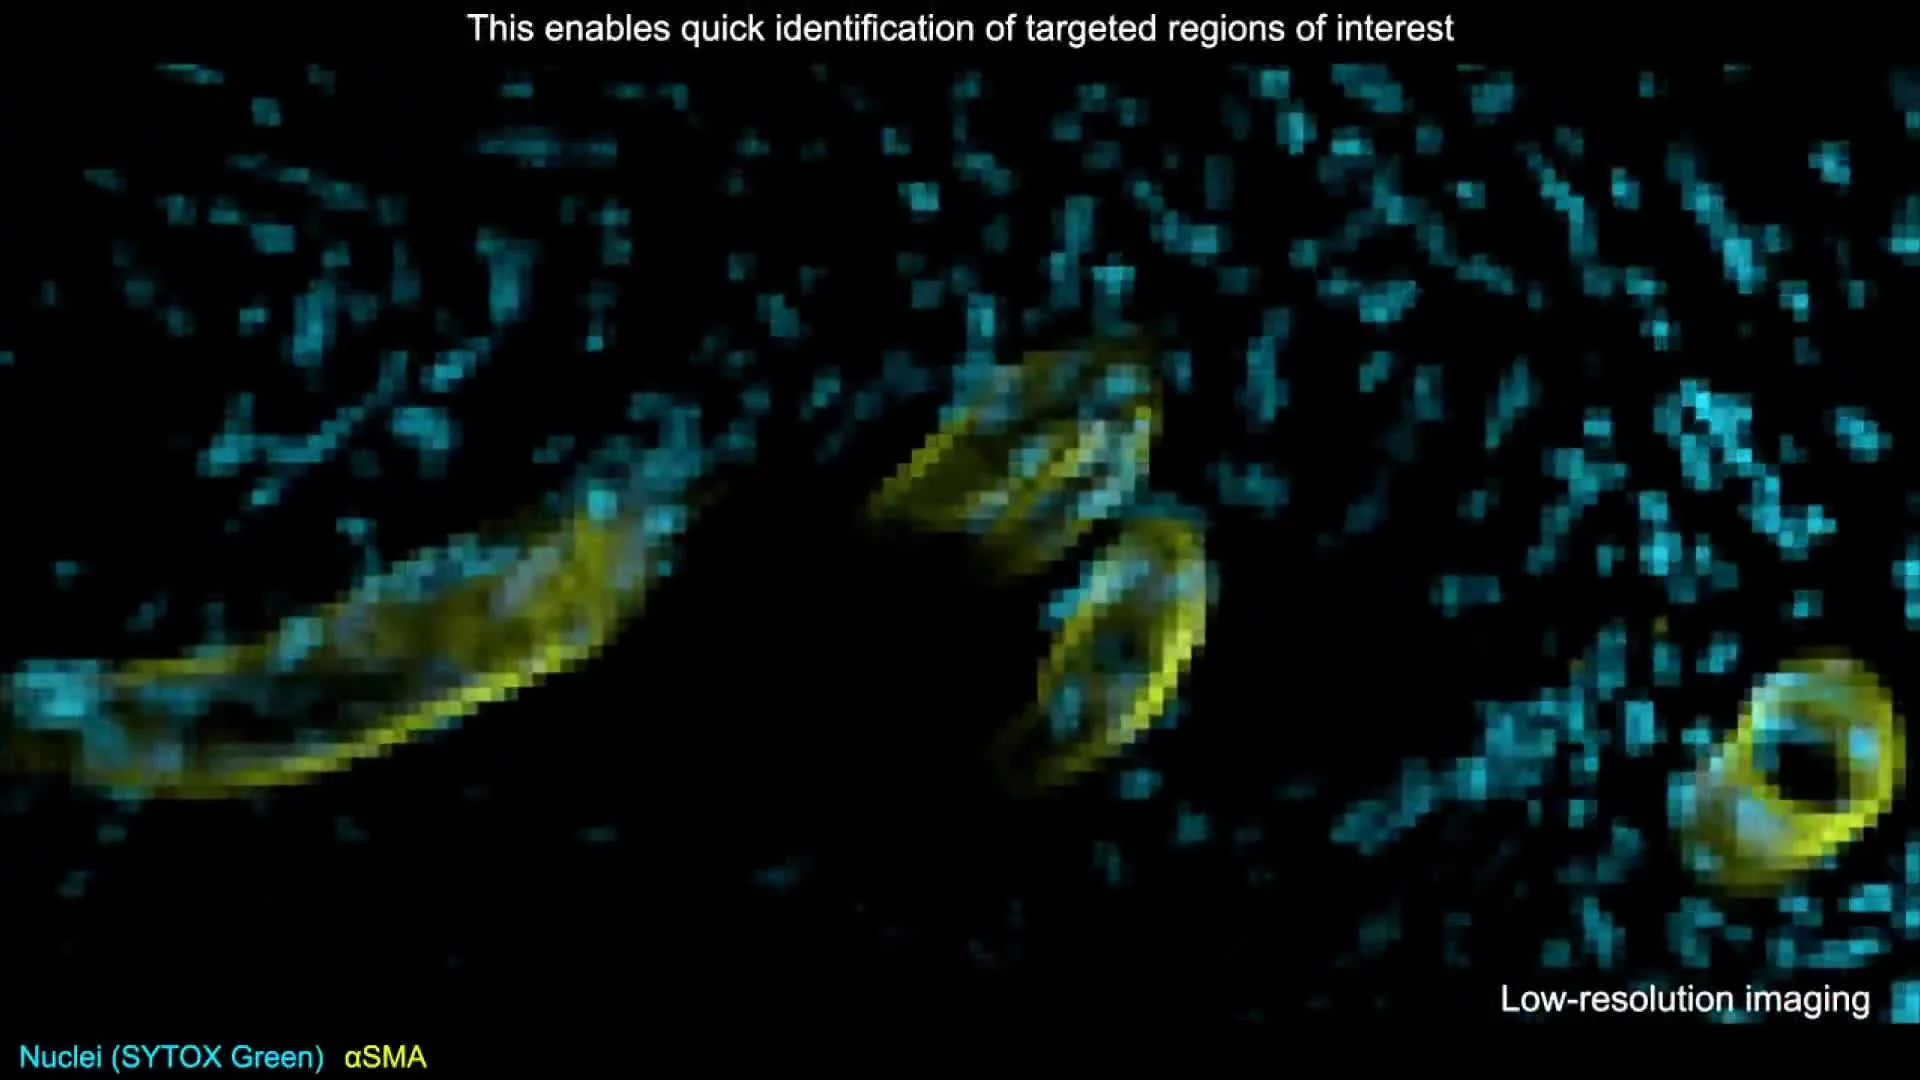
3D imaging of prostate organoids with LUMI shows ROI selection, multi-well scanning, and high-resolution analysis using TO-PRO-3 and eosin staining.
Prostate organoids are complex 3D models that demand a high-resolution, volumetric approach to imaging. This video demonstrates how LUMI (Light-Sheet User Microscope Interface) simplifies the process by combining low-resolution scanning with smart region selection and ultra-high-resolution imaging of specific areas.
Workflow with LUMI Smart Microscopy:
Fast pre-scan: Capture the entire organoid sample at low resolution.
ROI definition: Select regions of interest directly on the whole 3D raw image data.
Multi-ROI scanning: Efficiently image multiple organoids using LUMI’s multi-well setup.
In this example, prostate organoids are stained with TO-PRO-3 and eosin, then pseudocolored to enhance structural details. The result is a precise, multi-scale analysis of organoid organization, bridging low-resolution overview with single-cell clarity.
By pairing LUMI’s interface with the Aurora™ 3Di Hybrid Open Top Light Sheet (HOTLS) microscope, researchers gain seamless control over imaging workflows. Integration with 3Dm data management and 3Dai AI-powered segmentation further enables quantitative analysis of organoid growth, structure, and cellular interactions.
Applications extend to cancer biology, drug testing, and translational research, where prostate organoids serve as powerful disease models. LUMI accelerates these workflows, making 3D organoid imaging more accessible, reproducible, and insightful.
Evaluate the fit
See how 3D imaging could expand your facility
Review sample formats, user demand, acquisition workflows, and data requirements with the Alpenglow team. A virtual demonstration can show how Scout and Zoom imaging support varied projects within a shared imaging environment.
Learn more about the 3Di™ HOTLS microscope before scheduling your demonstration.
Experience the imaging workflow
See the microscope interface, Scout-to-Zoom workflow, and sample access in a guided virtual demonstration.

3D fluorescence imaging of mouse skin reveals the continuity and branching of sensory nerve networks across tissue depth. PGP9.5 highlights broader nerve architecture, while the Nav1.8-associated signal identifies a subset of sensory neurons.
This dataset presents mouse skin tissue imaged in 3D using fluorescence labeling. PGP9.5 highlights the broader nerve network, YO-PRO-1 labels nuclei, and Nav1.8-associated signal identifies a subset of sensory neurons.
The volumetric view preserves the continuity of nerve fibers across the imaged tissue depth, revealing large nerve bundles, finer branches, crossings, and terminal structures within dermal and epidermal regions.
With appropriate segmentation, the dataset can support measurement of nerve density, fiber length, branching, orientation, and spatial relationships with surrounding cells and tissue structures. These features are relevant to research on cutaneous innervation, sensory biology, pain, itch, inflammation, and treatment-associated changes in nerve architecture.
The tissue was imaged using the Aurora 3D™ Spatial Biology Solution, including the 3Di™ Hybrid Open-Top Light-Sheet microscope.