3D Tissue Imaging for Dermatology: Seeing Skin Biology As It Truly Is
“Skin is a 3D organ with layered architecture, nerves, and patchy inflammation. 3D tissue imaging and AI-powered analysis let you quantify innervation, map immune neighborhoods, and evaluate full-volume architecture that 2D slides often miss. Protocols optimized specifically for skin and studies in cleared human skin biopsies, melanoma, and keloid show why depth and continuity matter for dermatology.”
Why dermatology benefits most from 3D
Traditional 2D histology, examining thin, stained sections under a microscope, has long been the cornerstone of dermatopathology. However, the skin is a three-dimensional organ with a complex architecture, and a few slices cannot capture the full spatial context of its structures (1). Critical details may be lost: a nerve fiber might weave out of the plane of section, a capillary loop might be cut in cross-section, appearing as a mere dot, and an entire coiled sweat gland can be misconstrued as disparate islands on separate sections. Such spatial complexity and continuity are inherently flattened or fragmented in 2D. Moreover, pathologists must sample a small subset of tissue sections from a larger lesion, thereby risking sampling bias, as diagnostically or biologically essential features may be missed between slices. Quantitative analysis is also constrained; counts and measurements on 2D sections may not reflect true volumetric densities or 3D morphologies. In short, 2D histology underperforms for dermatologic tissue in terms of appreciating 3D architecture, spatial relationships, and true quantitative metrics.
Advances in 3D Histology
Emerging techniques in 3D tissue imaging are now addressing these gaps by rendering entire skin specimens transparent, known as “skin clearing,” and imaging them in three dimensions. Optical clearing methods, such as solvent-based or aqueous protocols, reduce light scattering and overcome the limited penetration of confocal or two-photon microscopes (2). When combined with light-sheet fluorescence microscopy (LSFM) or high-resolution confocal scans, cleared skin biopsies can be imaged in their entirety, yielding a digital 3D reconstruction of the tissue without physical sectioning (pubmed.ncbi.nlm.nih.gov). This approach unlocks true volumetric analysis, allowing measurement of structures in their full spatial extent (volumes, lengths, branching patterns) rather than as 2D projections. Crucially, it mitigates sampling bias by examining large contiguous tissue volumes or even whole biopsies, so one can assess an entire lesion’s architecture rather than extrapolating from a few slices. In essence, 3D histology recapitulates the tissue’s native organization. It enables quantitative histology at scale, allowing for the counting of cells in a volume, measurement of vessel lengths, or mapping of cell-cell distances in 3D space, all of which were previously impractical.
Notably, applying clearing and 3D imaging to human skin has required technical innovation because of the skin composition (dense collagen, melanin pigmentation, etc.). For example, earlier whole-organ clearing methods (like iDISCO developed for mouse tissues) did not work well on human skin. Recent optimized protocols, such as Skin-iDISCO+, specifically address these challenges (4). Skin-iDISCO+ introduced steps for efficient decolorization of melanin and improved antibody penetration, enabling light-sheet and confocal imaging of human skin with robust fluorescent immunolabeling (5). Such advances have made it feasible to visualize structures like the cutaneous microvasculature in 3D and extract morphometric data (e.g., vessel lengths, branching angles, spatial distribution) across the whole tissue volume. The following sections illustrate, through specific dermatologic contexts, how 3D tissue imaging provides scientific insights that 2D slides would miss or obscure. We delve into itch biology, immune cell architecture, hair and adnexal structures, melanoma pathology, and fibrosis, highlighting in each case the new metrics, spatial relationships, and interpretations unlocked by volumetric imaging.
Itch Biology and Cutaneous Innervation in 3D
Chronic itch conditions, such as atopic dermatitis and psoriasis, offer a striking example of the impact of 3D histology. Itch sensations are transmitted by networks of small nerve fibers in the skin, especially intraepidermal nerve fibers (IENFs). Yet, traditional 2D analyses yielded conflicting conclusions about these nerve networks in chronic itch: some studies reported hyper-innervation (increased nerve density) in pruritic skin, while others found nerve loss or reduction (6). This discrepancy arose in part from the method used to measure nerve density on 2D sections. Conventionally, a pathologist might count the number of nerve fiber endpoints crossing the epidermal basement membrane per unit length of skin section (6). A long, extensively branched nerve and a short stubby nerve could each contribute “one” count if they only cross the section once, meaning 2D metrics can severely under-represent true innervation. Additionally, slicing the tissue creates “nerve fragments” – fibers cut into pieces that might be missed or double-counted. In sum, traditional 2D nerve counts are coarse and can misestimate the actual nerve network, which is a complex 3D web.
Volumetric innervation analysis resolves these issues. Tan et al. pioneered a workflow for clearing and immunostaining full-thickness skin biopsies, as well as performing 3D nerve tracing through the entire volume. Using pan-neuronal markers, they digitally reconstructed the epidermal nerve networks in 3D and measured parameters like total nerve fiber length per epidermal volume, branch points, and fiber arborization. The difference in outcome was illuminating. In a cohort of patients with chronic itch, 3D imaging revealed a substantial loss of epidermal nerve fibers compared to healthy controls, resolving the earlier controversy in favor of nerve attrition in chronic lesions. Quantitatively, lesional atopic dermatitis skin showed a 60% reduction in total epidermal nerve fiber length, and psoriatic lesions showed a 74% reduction, compared to healthy skin. Likewise, nerve branching and arbor complexity were markedly decreased in the itchy lesions (73–85% fewer branches). These findings, only discernible by examining whole 3D nerve networks, suggest that chronic inflammatory itch may lead to nerve fiber retraction or degeneration, even as patients experience heightened itch (possibly due to the sensitization of remaining fibers).
Why was this insight “lost in 2D”? Tan et al. point out that earlier 2D methodologies each captured only part of the picture. Some counted nerve crossings per linear length, others measured fiber length in a single section area, and results varied. By contrast, their 3D volumetric analysis accounted for the full extent of nerve fibers and the actual epidermal volume in diseased skin. Notably, epidermal hyperplasia (thickening) in chronic dermatitis means a larger epidermal volume; if nerve fiber growth doesn’t keep up, the net density per volume drops. 2D measures that don’t account for this volume change could falsely suggest “normal” density on a per-length basis. The 3D approach both avoids generating arbitrary nerve fragments and captures secondary branches in all three dimensions. In fact, side-by-side comparisons showed that analyzing a healthy skin sample in 3D yields higher measured fiber lengths and volumes than any single 2D slice analysis of the same data.
In essence, 3D imaging provided a standardized, comprehensive measure of innervation that reconciled prior discrepancies. Beyond answering a research question, this has practical implications: volumetric nerve quantification could improve diagnosis of small-fiber neuropathies or evaluation of therapies (e.g. assessing re-innervation after treatment of chronic itch) with far greater sensitivity than 2D counts. The spatial profiling of nerves can also be extended to analyze nerve interactions with immune cells or epidermal structures, opening new avenues to understand neuroimmune crosstalk in itch. Such insights simply would remain hidden or ambiguous in 2D slides, but 3D imaging made the invisible visible in the skin’s neural architecture.
Immune Architecture and Spatial Profiling in 3D
Skin is an immune organ as much as it is a barrier. Immune cells are distributed in complex patterns, with T cells, dendritic cells, macrophages, and others occupying different niches. These cells cluster around hair follicles, patrol near vessels, or form aggregates in inflammatory diseases. Spatial relationships between these cells (who neighbors whom, and where) can be critical for understanding diseases like psoriasis, atopic dermatitis, or cutaneous lymphoma. Yet, with classic histology, we generally examine one or a few markers per slide, obtaining a 2D snapshot of a few hundred microns of tissue. This makes it nearly impossible to appreciate the full 3D immune architecture or to analyze more than a couple of markers at once. Even advanced multiplex 2D immunohistochemistry can layer many markers, but still only in a thin section. 3D multiplexed immunofluorescence now overcomes these limits, enabling what could be called volumetric immune profiling of skin.
A recent breakthrough by Scholaert et al. (7) demonstrated Highly Multiplexed 3D imaging of the human skin immune system. By combining optical clearing with a “Multiplex Annotated Tissue Imaging System”, they could visualize ten distinct fluorescent markers simultaneously in a single 3D scan of a skin sample. This means that in one cleared biopsy, T cell subsets, B cells, macrophages, blood vessels, and structural proteins could all be labeled and seen in situ, in relation to each other. They employed confocal microscopy with sequential imaging and computational deconvolution to separate signals (including autofluorescence), ensuring that each cell type’s marker could be distinguished. The result is a rich 3D map of immune cells within the intact tissue microenvironment.
The scientific value of such 3D immune architecture mapping is profound. It enables quantitative spatial analysis that 2D cannot do justice to. For example, one can measure the distance of each T cell to the nearest blood vessel throughout an entire dermis, or determine if T cells and dendritic cells form 3D clusters in a particular dermal region (perhaps indicative of tertiary lymphoid structures or focal inflammation). One can assess co-localization of multiple cell types in 3D: e.g., are CD4⁺ T cells and CD8⁺ T cells intermingling uniformly or segregating in different layers of the skin? Are macrophages forming a 3D network around hair follicles? In atopic dermatitis, volumetric imaging has revealed patterns like Langerhans cell density variations and T cells swarming around nerve fibers, insights that are being unraveled with these techniques (early studies have begun to show such patterns (6). Moreover, cell volume and morphology changes can be measured in 3D; an example is counting the total volume of a mast cell’s degranulation in tissue, or the full elongation of dendritic cell processes, rather than viewing a partial cross-section of these cells.
Importantly, multiplex 3D imaging allows integrative analysis of the immune microenvironment. In one volumetric dataset, we can simultaneously analyze epidermal T cell density, dermal dendritic cell clustering, and their spatial relationship to nerve fibers or blood vessels. In psoriasis lesions, this could help correlate T-cell microenvironments with nerve alterations (since psoriasis involves both immune activation and itch). In cutaneous oncology, such as melanoma (discussed below), 3D immune profiling can map immune infiltrates throughout a tumor to identify niches of immune privilege or exclusion that wouldn’t be obvious on a couple of sections.
While these multiplex 3D methods are still cutting-edge, they foreshadow a new era of spatially resolved immunology in skin. By capturing the full topology of immune cells, 3D spatial profiling reveals patterns such as network-like distributions or gradients of cells from the epidermis to the deeper dermis, which 2D sections might misconstrue or miss. This is especially valuable in diseases with subtle architectural changes, such as early cutaneous lymphoma, where malignant T cells may form focal collections that only a 3D survey could reliably detect in a biopsy. In summary, 3D tissue imaging provides a holistic view of skin’s immune architecture, enabling analyses of cellular relationships and quantitative densities across entire volumes that redefine our understanding of skin immunology beyond the flattened view of traditional slides.
Hair Follicles and Associated Structures: Preserving Anatomy in 3D
Human skin contains a variety of complex structures, including hair follicles, sebaceous glands, sweat glands, and their associated muscles and ducts, all organized in a 3D structure. These structures often span across multiple histologic sections in depth, making them notoriously difficult to interpret from 2D slices alone. Hair follicles, for instance, are long tubular invaginations of epidermis that extend deep into the dermis or subcutis. In a vertical 2D section, you might catch a segment of a follicle; in a horizontal section, you could see an oval or circle representing a cross-section of the follicle. But no single section shows the entire follicle from surface opening down to the bulb. Likewise, coiled sweat glands appear in cross-section as clusters of circular profiles; a pathologist mentally reconstructs these as a single coiled tube, but only by inference. In routine practice, fragmentation of these structures can even lead to misdiagnosis – e.g. mistaking tangentially cut glands for invasive nests of carcinoma. Here, 3D imaging offers a definitive solution: the ability to reconstruct units in their entirety within the intact skin.
Using optical clearing and LSFM, researchers have visualized whole human hair follicles and glands in 3D, maintaining their connections and spatial context in the skin (8). Abadie et al. demonstrated that by clearing a ~5 mm thick skin biopsy and using light-sheet microscopy, all epidermal appendages could be observed in situ within the intact tissue. The stratum corneum, viable epidermis, dermal matrix, and appendages (hair follicles, sebaceous units, and sweat glands) were all identifiable in the 3D volume, with no sectioning artifacts. They were able to digitally “fly through” the skin layers and even perform 3D measurements, for example, quantifying epidermal thickness (hyperplasia) over broad areas rather than just at a single cut point. This method brings a new level of anatomical fidelity. A hair follicle can be segmented and rendered in 3D, allowing one to measure its exact length and curvature, count the number of sebaceous lobules attached, and see the arrector pili muscle insertion, all in one contiguous view. In disease contexts like scarring alopecia (hair follicle destruction by immune attack), 3D imaging could show the precise pattern of follicular dropout and inflammatory cell distribution around entire follicles, whereas 2D sections might capture only partial evidence of a process that wraps around or along the follicle’s length.
Another advantage is the ability to visualize relationships between skin structures and other components. For instance, in 3D one can appreciate how blood vessels and nerve fibers arborize around a sweat gland coil or how immune cells cluster at the base of hair follicles (a known phenomenon in alopecia areata and other conditions). On a single 2D section, one might see a few immune cells near part of a follicle and not realize that in 3D, they form a dense cuff encircling the follicle. Essentially, the volumetric context prevents the misinterpretation that can arise from tangential or oblique sectioning in conventional histology.
From a quantitative angle, volumetric analysis of skin structures becomes possible. How much volume does a sebaceous gland occupy, and does this change in acne or sebaceous hyperplasia? How tortuous and long are sweat gland ducts, and could this be a metric for certain skin conditions? 3D data allows for the extraction of these numbers. It also aids digital dermatopathology: algorithms can be applied to the 3D dataset to automatically identify and count hair follicles or glands, much as image analysis is now done on 2D whole-slide images. This could be particularly useful for research and diagnostics in hair loss disorders (such as a software that computes the 3D hair follicle density and size distribution in a scalp biopsy) or in hidradenitis suppurativa, where tracking 3D sinus tract formations and associated glands could aid in understanding the disease. In summary, 3D tissue imaging preserves and presents the true anatomy of hair and associated structures, eliminating ambiguities of sectioning and enabling measurements of their architecture that were beyond reach in 2D.
Melanoma Microenvironment: 3D Mapping of Tumor and Stroma
Melanoma, an aggressive skin cancer, illustrates how 3D histology can enhance tumor pathology and research. In cutaneous melanoma, tumor cells infiltrate the dermis and can spread radially and vertically, often in complex patterns. Prognosis is influenced by features such as the depth of invasion and ulceration (which are assessed in 2D), as well as the tumor’s microenvironment, including the density and distribution of blood vessels, lymphatics, and immune infiltrates within and around the tumor. Traditional pathology examines these factors on sections. Microvessel density might be counted in hot spots on a single slide, and immune cells are graded by eyeballing their abundance. However, melanoma tumors are heterogeneous, and a few sections may not reflect the whole tumor’s characteristics. This is where 3D volumetric analysis offers a more comprehensive view of the tumor architecture and its surrounding environment.
Recent work has established protocols to clear and immunolabel entire human melanoma samples for 3D imaging (9). Gómez-Gaviro et al. reported the clearing of human melanoma tumor tissues (including biopsies and xenografts) using a hydrophilic CUBIC protocol and the performance of 3D light-sheet microscopy with vascular and cellular markers. They achieved 3D volumetric visualization of the tumor microenvironment, vasculature, and cell populations in these melanomas. One immediate benefit of 3D imaging was the ability to evaluate tumor vasculature throughout the entire lesion. Blood vessels in melanoma can be irregularly distributed – some areas of the tumor are highly vascular (angiogenic hot spots), while others are poorly perfused. A 2D section might cut through either a dense area or a sparse area by chance. In contrast, the 3D reconstruction allowed mapping all blood vessels within the tumor volume and quantifying their overall density and spatial distribution. Researchers could measure vessel tortuosity, branch counts, and even analyze the relative proximity of blood vessels to melanoma cell clusters. This matters because vessel density and distribution relate to how the tumor grows and spreads; for example, regions of tumor far from vessels may be hypoxic and more aggressive. 3D quantitative histology thus opens the door to metrics such as the total vascular volume fraction of a tumor or the degree of vessel clustering, which are more robust than a microvessel count on a single slide.
Another critical aspect is the immune infiltrate. In melanoma, the presence of T-lymphocytes and other immune cells (the tumor-infiltrating lymphocytes, TILs) is a key prognostic and predictive factor, especially in the era of immunotherapy. On a 2D section, a pathologist might semi-quantitatively grade TILs as “brisk, non-brisk, or absent,” based on how many are seen in parts of the tumor. But tumors are 3D entities where immune cells may not be uniformly distributed. 3D imaging can reveal, for example, if T cells are concentrating at the tumor periphery versus deeply infiltrating, or if they form small nodules at particular regions of the tumor. By immunolabeling T cell markers in a cleared melanoma, one can count every T cell in the tumor volume, measure distances between T cells and tumor cells, and identify immune deserts (areas with few immune cells) versus heavily infiltrated zones. This level of detail is invaluable for research into tumor immunology, as one can correlate these spatial patterns with regions of high melanoma cell proliferation or with the expression of checkpoint molecules. Indeed, Scholaert’s multiplex 3D imaging approach has been extended to tumors, including metastatic melanoma in skin, to profile such immune niches in 3D. These studies show that 3D spatial profiling in tumors can uncover microanatomical niches, such as perivascular T cell cuffs or compartmentalized groups of macrophages, that are not apparent in 2D but could influence how a tumor responds to treatment.
Melanoma’s tendency to microscopically extend beyond what is seen at the surface is another challenge for conventional histology. Surgeons rely on pathology of margins to decide if a tumor is fully excised. 3D imaging could assist here by allowing examination of an entire excised specimen’s margins in one volumetric sweep, potentially increasing sensitivity for tiny tumor satellites or projections. While this application is still in development, one can imagine using digital 3D dermatopathology for melanoma excisions: the tissue is cleared, stained for melanoma markers (like S100 or SOX10), and a digital 3D model of the specimen is examined for any residual tumor at the inked margins.
In summary, 3D tissue imaging provides a more complete and quantitative portrait of melanoma tumors. It captures the tumor and its microenvironment (vessels, immune cells, stroma) in one integrated dataset, addressing spatial heterogeneity head-on. This yields new metrics – total tumor volume occupied by T cells, 3D microvessel density, spatial relationships between tumor cell clusters and stromal elements – that deepen our understanding of tumor biology. These insights can be lost or ambiguous in 2D slides, where one is effectively looking at a few needle-like cross-sections through a complex 3D puzzle. By reconstructing that puzzle fully, 3D histology adds a powerful dimension to dermatopathology of skin cancers.
Fibrosis and Keloid Scars: Visualizing 3D Vascular Remodeling
Fibrotic skin disorders provide another arena where 3D imaging adds tremendous value. Keloids, for example, are pathological scars characterized by exuberant collagen deposition and tissue overgrowth beyond the wound boundary. Clinically and histologically, keloids are known to have altered vasculature – patients often note that they are pink or purplish (suggesting an abundance of blood vessels), and microscopic sections reveal abnormal vessels. However, exactly how the vasculature is organized in keloids versus normal skin was not well understood, with conflicting reports historically on whether keloids are hyper-vascular or simply disorganized. One reason for confusion is that in a thick scar, blood vessels are heterogeneously distributed and can be oriented in unusual ways (e.g., vertically oriented vessels piercing up through the scar). A 2D section might by chance hit or miss clusters of vessels, or cut longitudinally vs cross-sectionally, giving an incomplete picture. 3D clearing and imaging of keloids has now resolved these uncertainties by allowing researchers to examine the entire vascular network within scar tissue (10).
Nguyen et al. performed a comprehensive 3D analysis of keloid vasculature using optical clearing and both confocal and light-sheet microscopies. By immunostaining for CD31 (an endothelial marker) and imaging whole keloid tissue blocks, they reconstructed the full 3D blood vessel network throughout keloid scars and compared it to that of normal skin. The findings provided new, nuanced insight: keloids indeed have excessive vascularization predominantly in the upper dermis. In normal skin, there’s a fine loop of capillaries in the papillary dermis (just below the epidermis) and a horizontal superficial vascular plexus at the interface of papillary and reticular dermis, with fewer vessels in the deeper reticular dermis. Keloids, however, showed a higher density of vessels in both the papillary dermis and the upper reticular dermis compared to normal skin. The entire reticular dermis of keloids was significantly thickened, and within it, the upper portions were highly vascularized, far more than in a normal scar or skin. Perhaps most interestingly, the lower reticular dermis of keloids contained blood vessels that were vertically oriented, running perpendicular to the skin surface (something rarely seen in uninjured skin). While these vertical vessels were fewer in number than the horizontal upper plexus, their presence and orientation suggest a profound remodeling of the blood supply in the scar. All these detailed observations were possible because the entire scar’s vessel network could be traced and quantified in 3D.
From these data, Nguyen et al. concluded that excessive and spatially altered vascularization in the papillary and upper reticular dermis is a hallmark of keloid pathology. This has implications for understanding keloid growth: the abundant upper blood supply might drive active collagen production or sustained inflammation, contributing to the keloid’s persistent growth. Previously, a single 2D section might show a portion of this network and lead to conflicting interpretations (depending on section depth or orientation). The 3D approach thus settled debates by showing the complete pattern of vessel architecture in keloids. Quantitatively, researchers could now measure total vessel length, branch counts, and even vessel diameter distribution within the scar. Such morphometric parameters are valuable for comparing keloids to other scars or evaluating treatments (for instance, does an anti-VEGF therapy reduce the overall vessel length in a keloid?).
Beyond vessels, fibrosis often involves spatial patterns of collagen and cells that are 3D in nature (e.g., whorled collagen nodules or fibrotic septa). Three-dimensional imaging of cleared fibrotic tissue, with appropriate labeling (such as collagen autofluorescence or fluorescent collagen-binding probes), can reveal the arrangement of collagen fibers throughout a lesion. In systemic sclerosis or morphea (localized scleroderma), for example, one can visualize the collagen deposition pattern in 3D and how it relates to associated structures or vasculature. Similarly, in late-stage burn scars, 3D imaging may reveal the spatial relationship between the scarred dermis and the regrowth of adnexal structures, such as sweat glands, which has regenerative implications.
The keloid study serves as a template: 3D histopathology in fibrosis can identify structural alterations (like abnormal vessel orientation or density) that 2D might only hint at. It demonstrates the power of volumetric imaging to quantify pathological changes in a robust way. In keloids, this meant finally being able to say with confidence that “yes, keloids have more blood vessels in these specific dermal regions, and here is by how much,” rather than relying on semi-quantitative section estimates. It exemplifies how 3D tissue imaging adds a new dimension of understanding to dermatopathology, especially for diseases where architecture and spatial relationships are key to the disease process.
A practical pipeline for skin, from biopsy to insight
Define the question. Pick markers that reflect your hypothesis and your readout, for example PGP 9.5 for innervation, CD45 plus T-cell subsets for inflammation, keratin or collagen for architecture, vascular markers when perfusion matters.
Use skin-appropriate clearing. Favor solvent-based approaches for ECM-rich tissue, and follow Skin-iDISCO+ when labeling human cutaneous vasculature or other targets that require deep, even penetration. https://pubmed.ncbi.nlm.nih.gov/39709611/
Scan whole tissue, then zoom. Acquire a low-resolution scout scan of the intact biopsy for orientation, select predefined regions for high-resolution imaging at the cellular scale. See Low to High Resolution in action.
Quantify with AI-powered analysis. Convert images into volumetric metrics such as nerve fiber volume or length per tissue volume, lymphocyte distance to the dermal–epidermal junction, or immune density, then validate with inter-rater checks on representative volumes. Your white paper illustrates how 3D analysis stabilizes these metrics relative to 2D.
What 3D adds to digital dermatopathology
Whole-tissue architecture preserved. You see continuous glands, vessels, nerves, and tunnels, so rare or tortuous features are less likely to be missed, and the structure's identity is less ambiguous.
Quantitative tissue analysis at scale. Volumetric counts, distances, and neighborhood features are reproducible across lesions and visits, which supports endpoints for trials and translational studies.
Spatial profiling in three axes. Relationships that are invisible in 2D, such as nerve-to-immune proximity, become measurable features rather than anecdotal observations.
Skin-optimized clearing and LSFM are practical now. Primers and surveys explain the why and the how for skin compared with other tissues, including reagent selection and index matching. https://www.sciencedirect.com/science/article/pii/S0079633616300043 | https://pmc.ncbi.nlm.nih.gov/articles/PMC8815095/
Conclusion
3D tissue imaging is redefining what “histology” can mean for skin pathology. By overcoming the planar constraints of 2D sections, it allows dermatopathologists and researchers to see the spatial reality of tissue architecture in skin biopsies – be it the labyrinth of nerve fibers mediating itch, the dynamic choreography of immune cells in inflammation, the intricate anatomy of hair follicles and glands, the heterogeneous microenvironment of a tumor, or the reorganized vasculature of a scar. In each of the cases we explored, volumetric imaging provided insights that would be lost or ambiguous in traditional slides, directly addressing spatial complexity, sampling bias, and quantification gaps. We can now measure what was previously unmeasurable: lengths of nerve in the epidermis, volumes of an entire sebaceous gland, the 3D proximity of a T cell to a melanoma cluster, or the percentage of a scar occupied by blood vessels – all with a level of precision and context that 2D methods cannot attain.
These advances are fueled by innovations in skin clearing, immunolabeling, and microscopy (e.g., light-sheet and advanced confocal techniques), coupled with powerful image analysis algorithms for digital 3D pathology. The field is rapidly evolving. Today’s cutting-edge research demonstrations could become tomorrow’s clinical tools.
One can envision a near future where dermatopathology reports for complex diseases include quantitative 3D metrics, such as “nerve fiber length density” or “3D tumor-infiltrating lymphocyte density,” supplementing the classic H&E interpretation. Digital dermatopathology is expanding from scanning slides to reconstructing volumes, and this will likely enhance diagnostic accuracy and prognostic assessments. There are challenges ahead, of course – from the time and cost of 3D processing to data storage and the need to train pathologists to navigate 3D images – but the value proposition is clear.
By capturing the skin in all three dimensions, we honor the true biology of the tissue.
In conclusion, 3D tissue imaging is pushing dermatology and pathology into a new era of quantitative, spatially-resolved analysis. It complements the rich history of 2D histology by adding depth literally and figuratively: we gain deeper scientific insight and stronger value framing for tissue analysis. As techniques like skin clearing and light-sheet microscopy become more accessible, and as we develop better software to visualize and quantify these large datasets, 3D histology is poised to move from specialized labs into broader research and clinical practice. The result will be a more comprehensive understanding of skin diseases – seeing not just isolated slices, but the full picture in all its spatial glory. This is quantitative 3D dermatopathology, and it holds the promise of more accurate diagnoses, novel biomarkers, and a new appreciation of the complex beauty of tissue architecture that has been there all along, waiting for us to look in 3D.
References and resources, quick list
Tan Y, Ng WJ, et al., 3D optical clearing of pruritic skin shows downregulation of epidermal innervation, J Invest Dermatol 2019. PubMed: https://pubmed.ncbi.nlm.nih.gov/30471253/ PubMed
Delage E, et al., 3D imaging of cleared samples with LSFM, primer, Front Bioeng Biotechnol 2023. PMC: https://pmc.ncbi.nlm.nih.gov/articles/PMC10583220/ PMC
Brenna C, et al., Optical tissue clearing and 3D imaging in diagnosis, Histochem Cell Biol 2022. PubMed: https://pubmed.ncbi.nlm.nih.gov/35235045/ | PMC: https://pmc.ncbi.nlm.nih.gov/articles/PMC9114043/ PubMedPMC
Vieites-Prado A, Renier N, Tissue clearing and 3D imaging, putting immune cells into context, J Cell Sci 2021. PubMed: https://pubmed.ncbi.nlm.nih.gov/34342351/ | Journal: https://journals.biologists.com/jcs/article/134/15/jcs258494/271108/ PubMedBiologists Journal
Jacob AM, et al., Autofluorescence-based tissue characterization for LSFM, Scientific Reports 2024. PubMed: https://pubmed.ncbi.nlm.nih.gov/39098935/ | Journal: https://www.nature.com/articles/s41598-024-67366-2 PubMedNature
Alpenglow Biosciences, Atopic dermatitis biopsy in 3D, LinkedIn: https://www.linkedin.com/posts/alpenglow-biosciences_unprecedented-detail-in-atopic-dermatitis-activity-7098379051461163008-JqBR
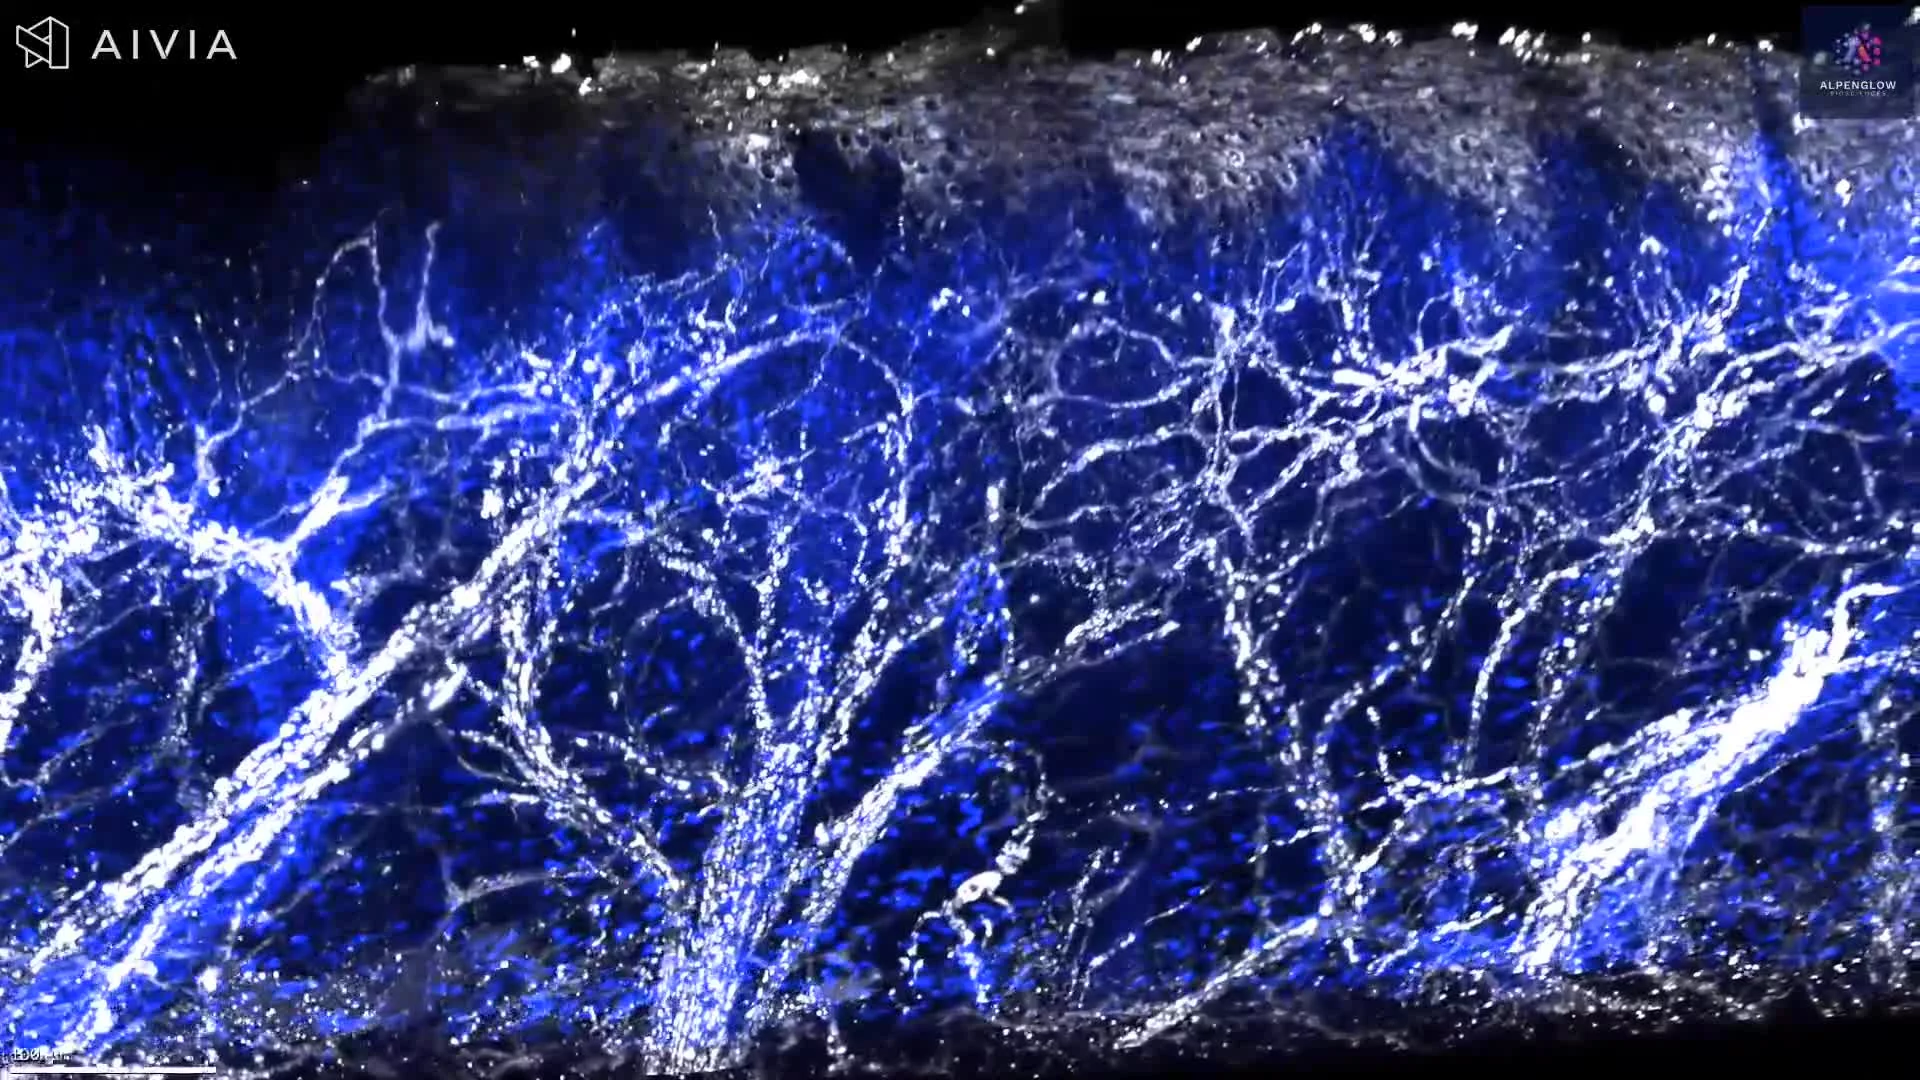
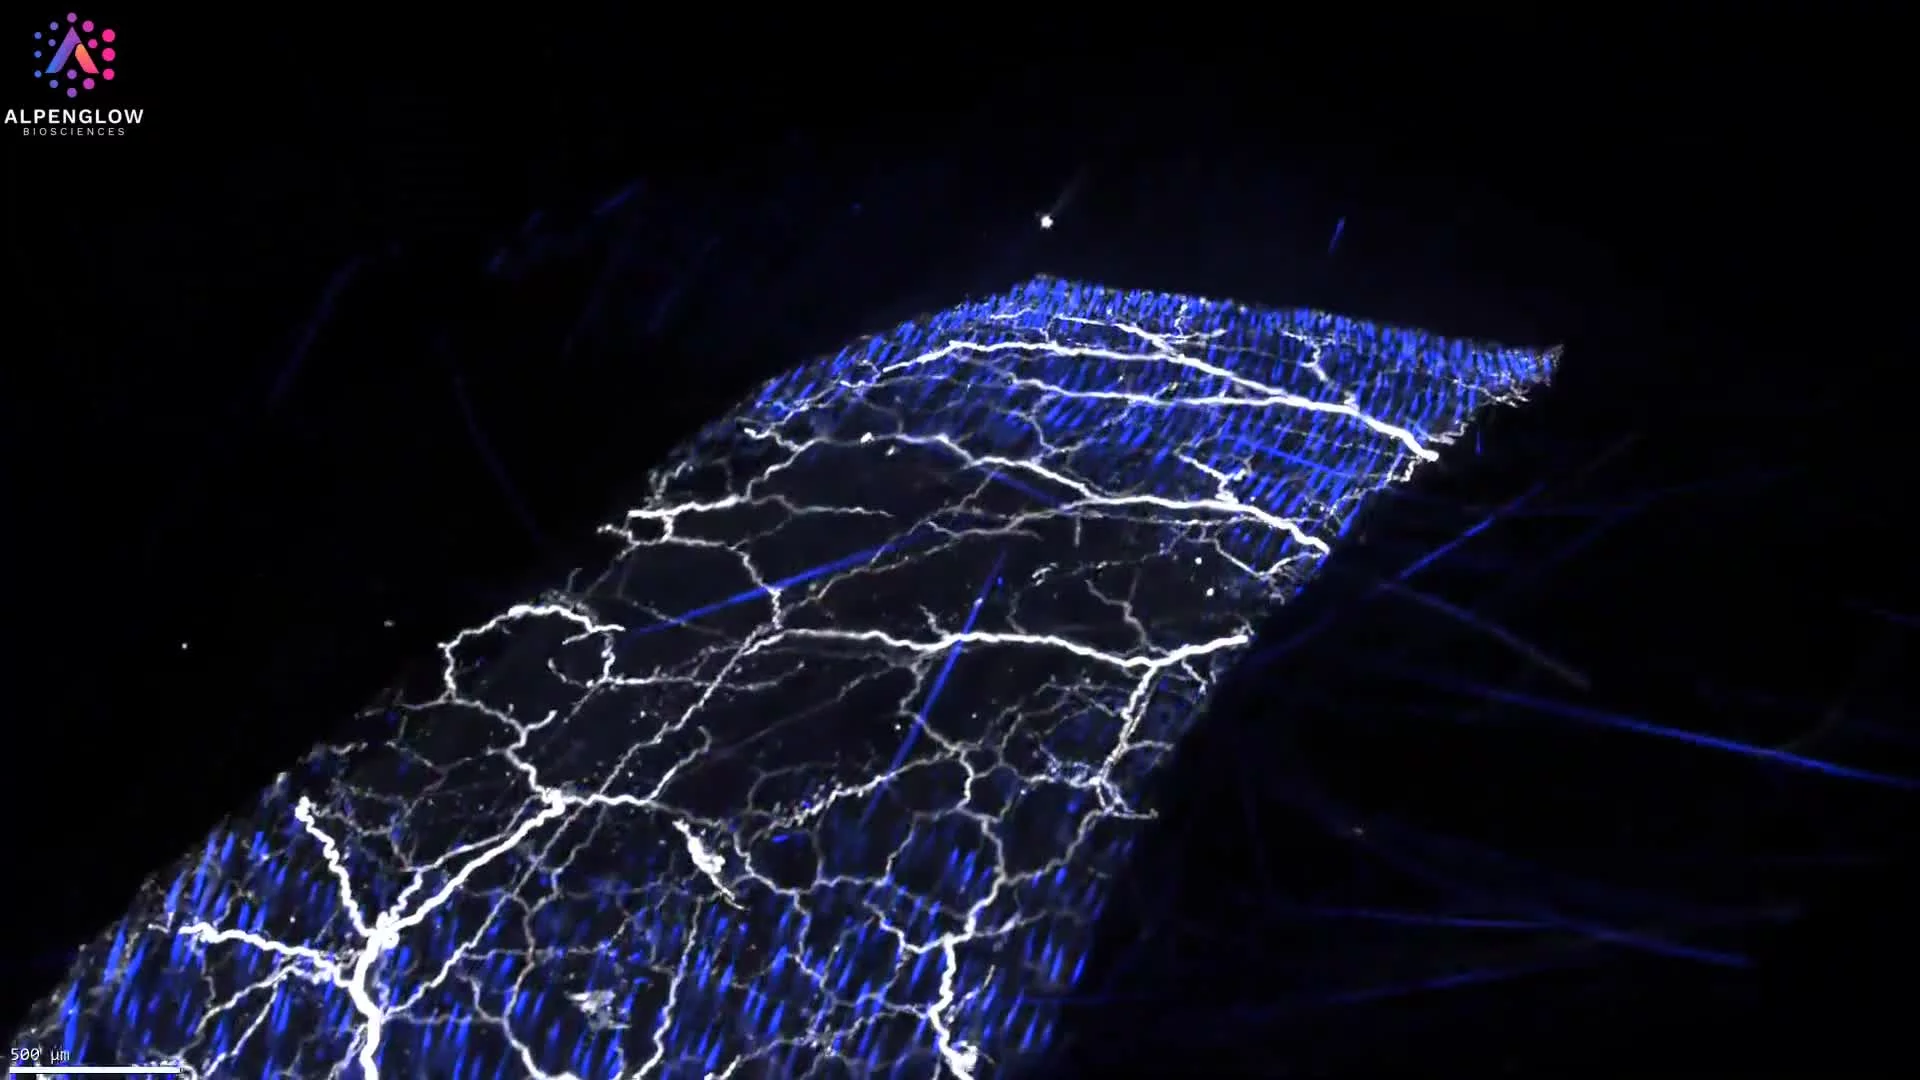
3D fluorescence imaging of mouse skin reveals the continuity and branching of sensory nerve networks across tissue depth. PGP9.5 highlights broader nerve architecture, while the Nav1.8-associated signal identifies a subset of sensory neurons.
This dataset presents mouse skin tissue imaged in 3D using fluorescence labeling. PGP9.5 highlights the broader nerve network, YO-PRO-1 labels nuclei, and Nav1.8-associated signal identifies a subset of sensory neurons.
The volumetric view preserves the continuity of nerve fibers across the imaged tissue depth, revealing large nerve bundles, finer branches, crossings, and terminal structures within dermal and epidermal regions.
With appropriate segmentation, the dataset can support measurement of nerve density, fiber length, branching, orientation, and spatial relationships with surrounding cells and tissue structures. These features are relevant to research on cutaneous innervation, sensory biology, pain, itch, inflammation, and treatment-associated changes in nerve architecture.
The tissue was imaged using the Aurora 3D™ Spatial Biology Solution, including the 3Di™ Hybrid Open-Top Light-Sheet microscope.