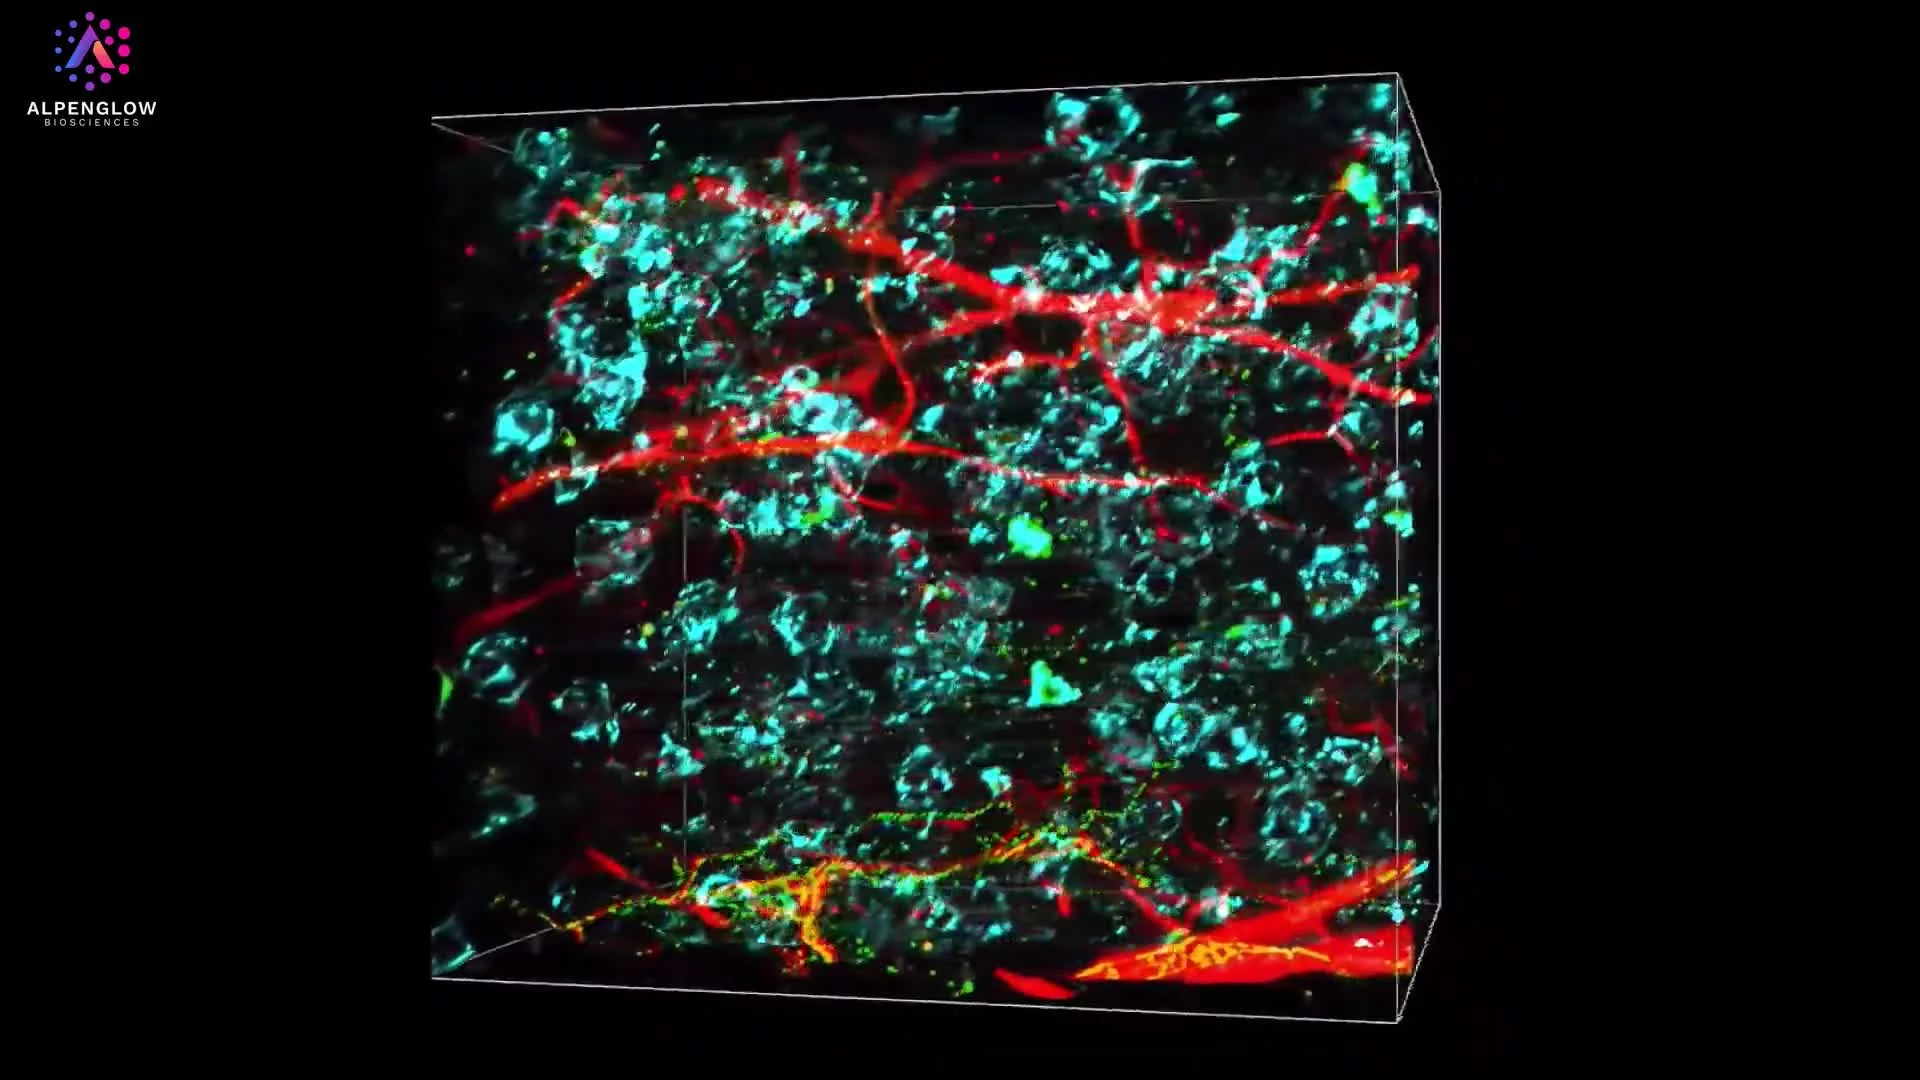
3D Visualization of TLS-Associated Immune Organization in an Intact Mouse Colorectal Tumor
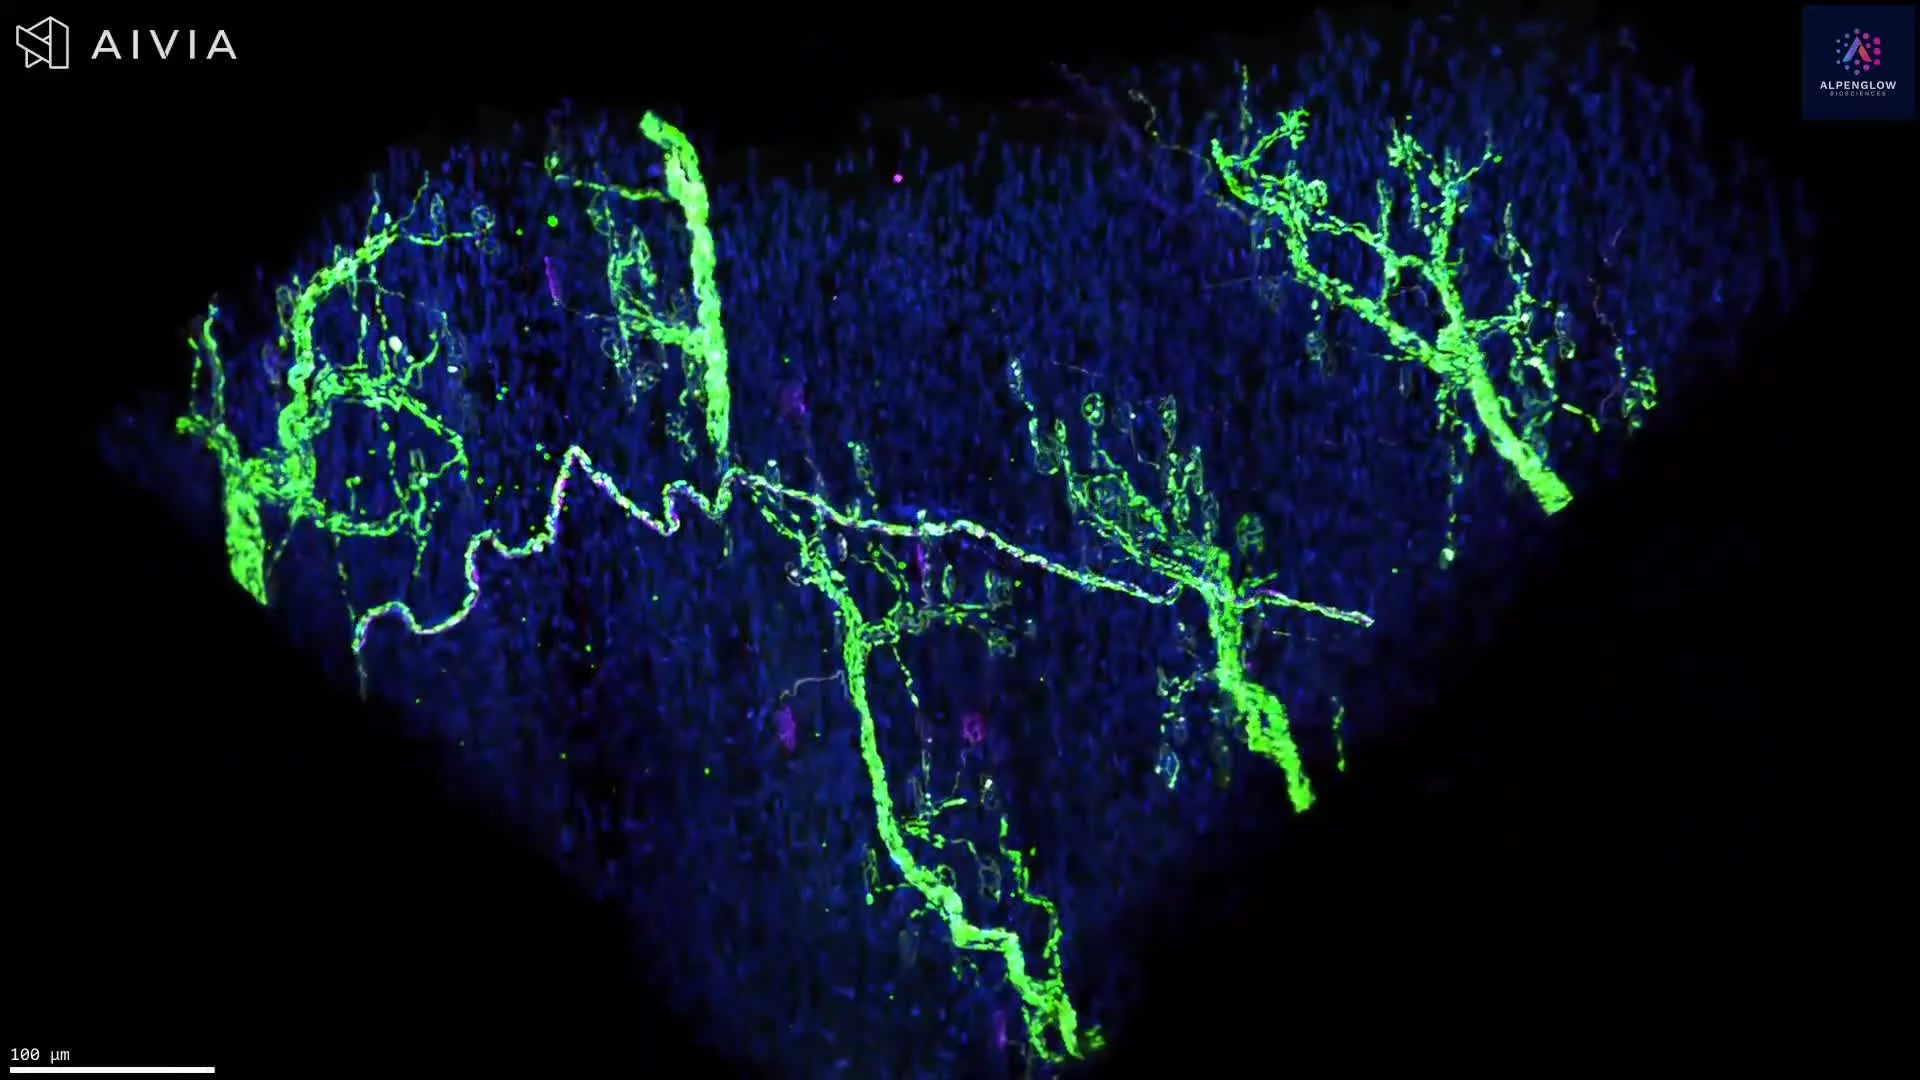
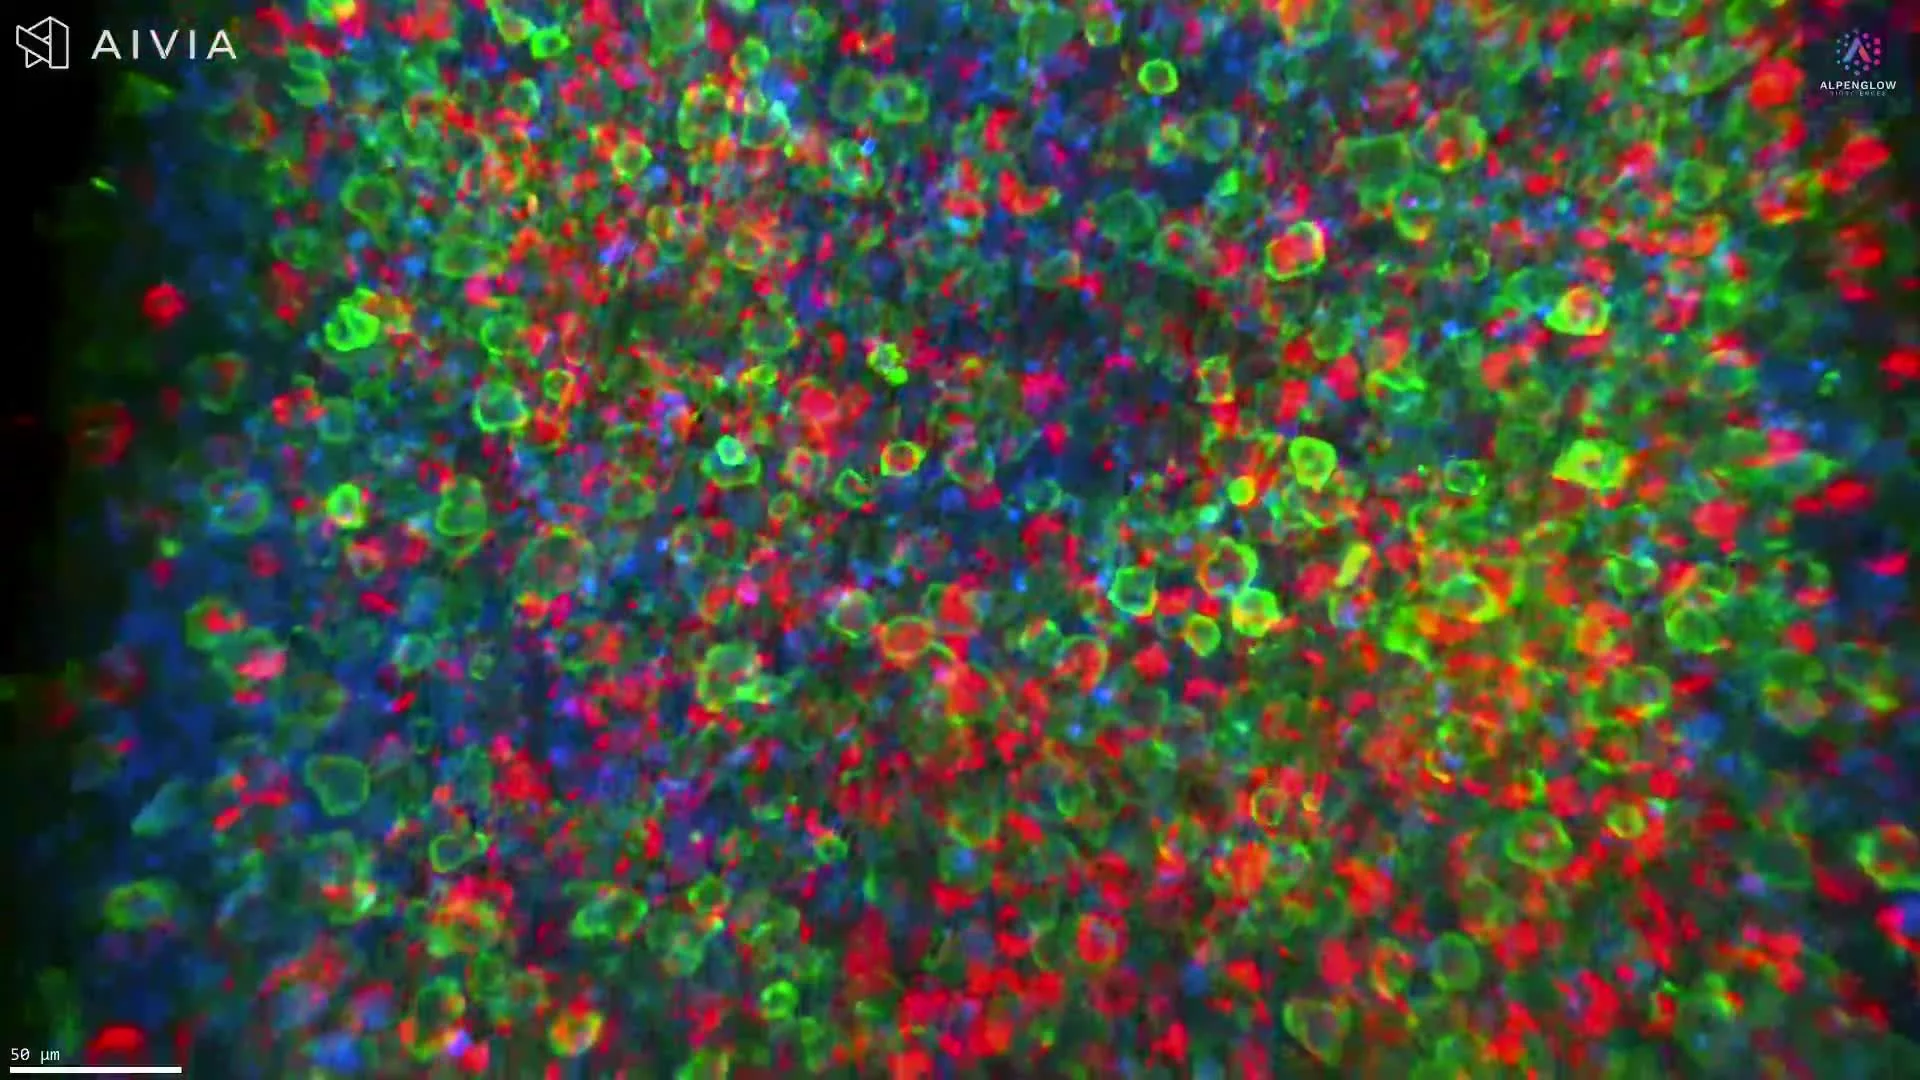
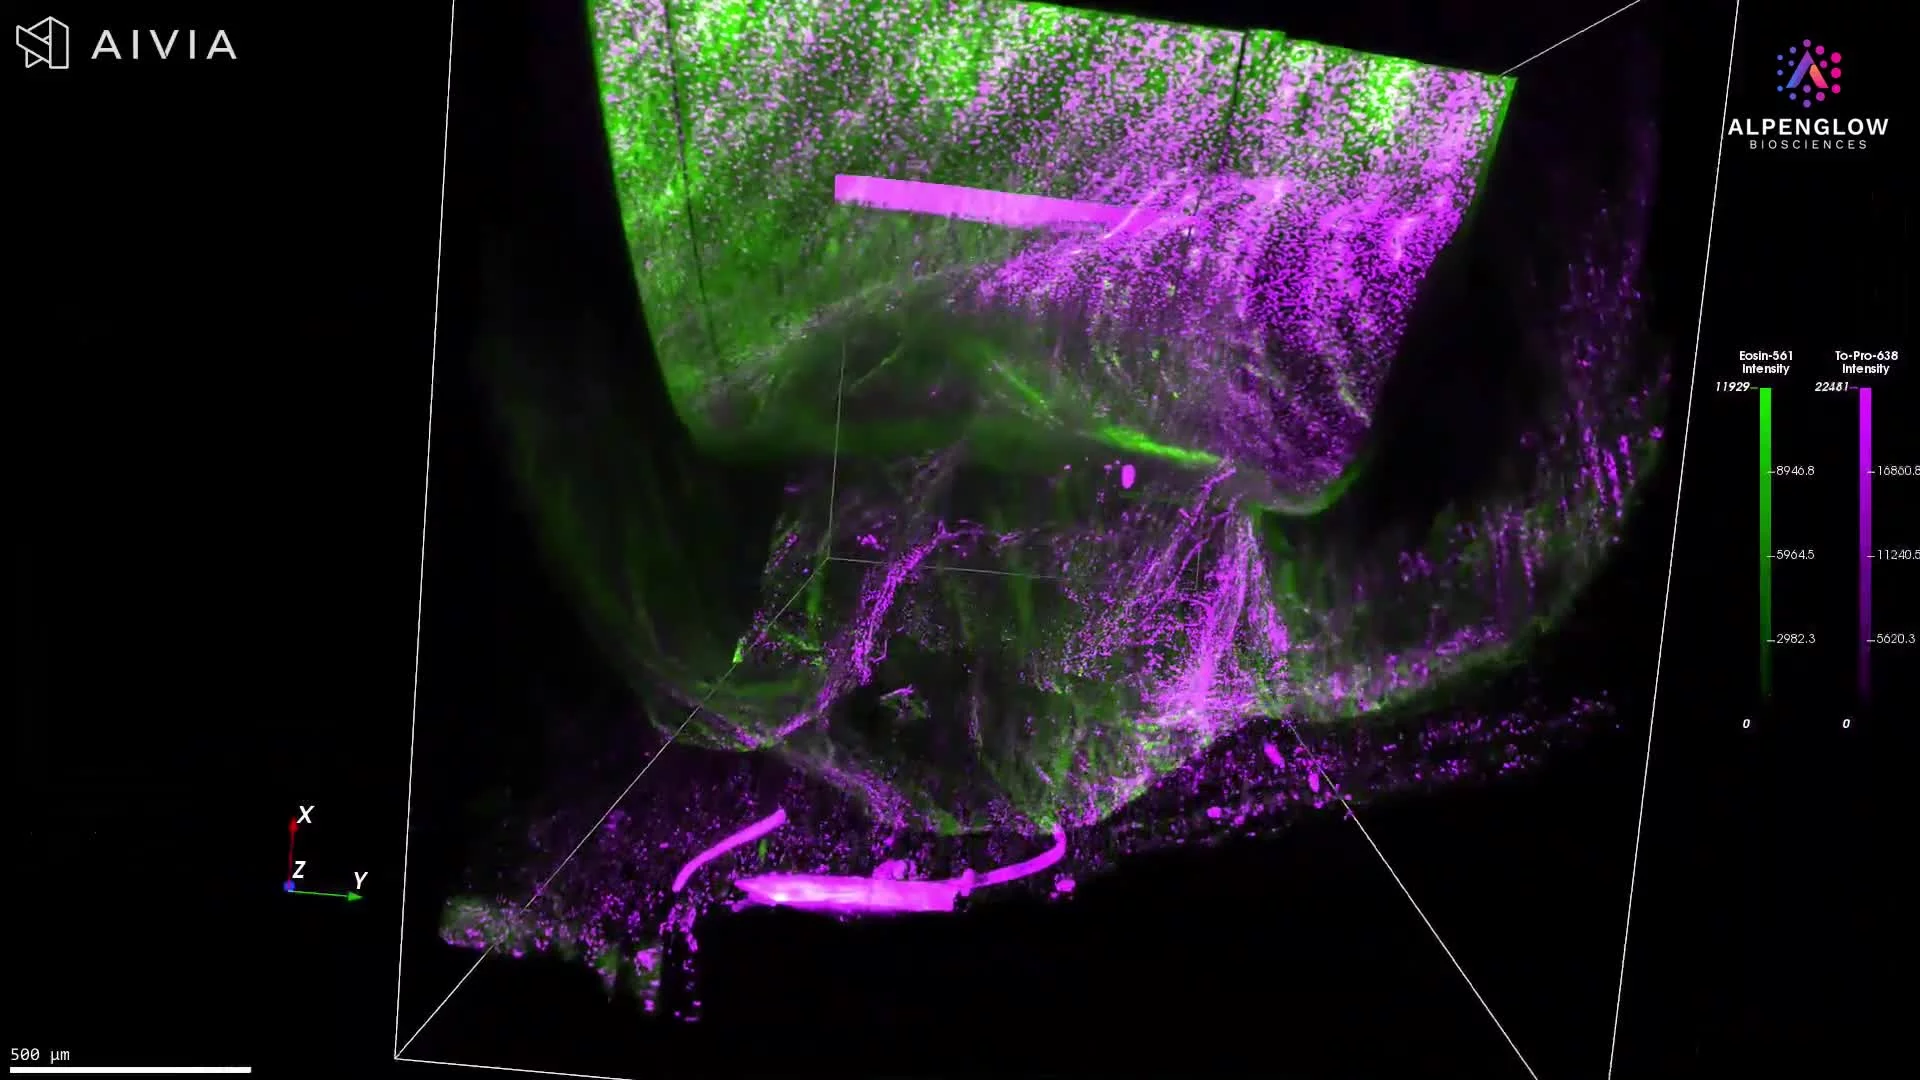
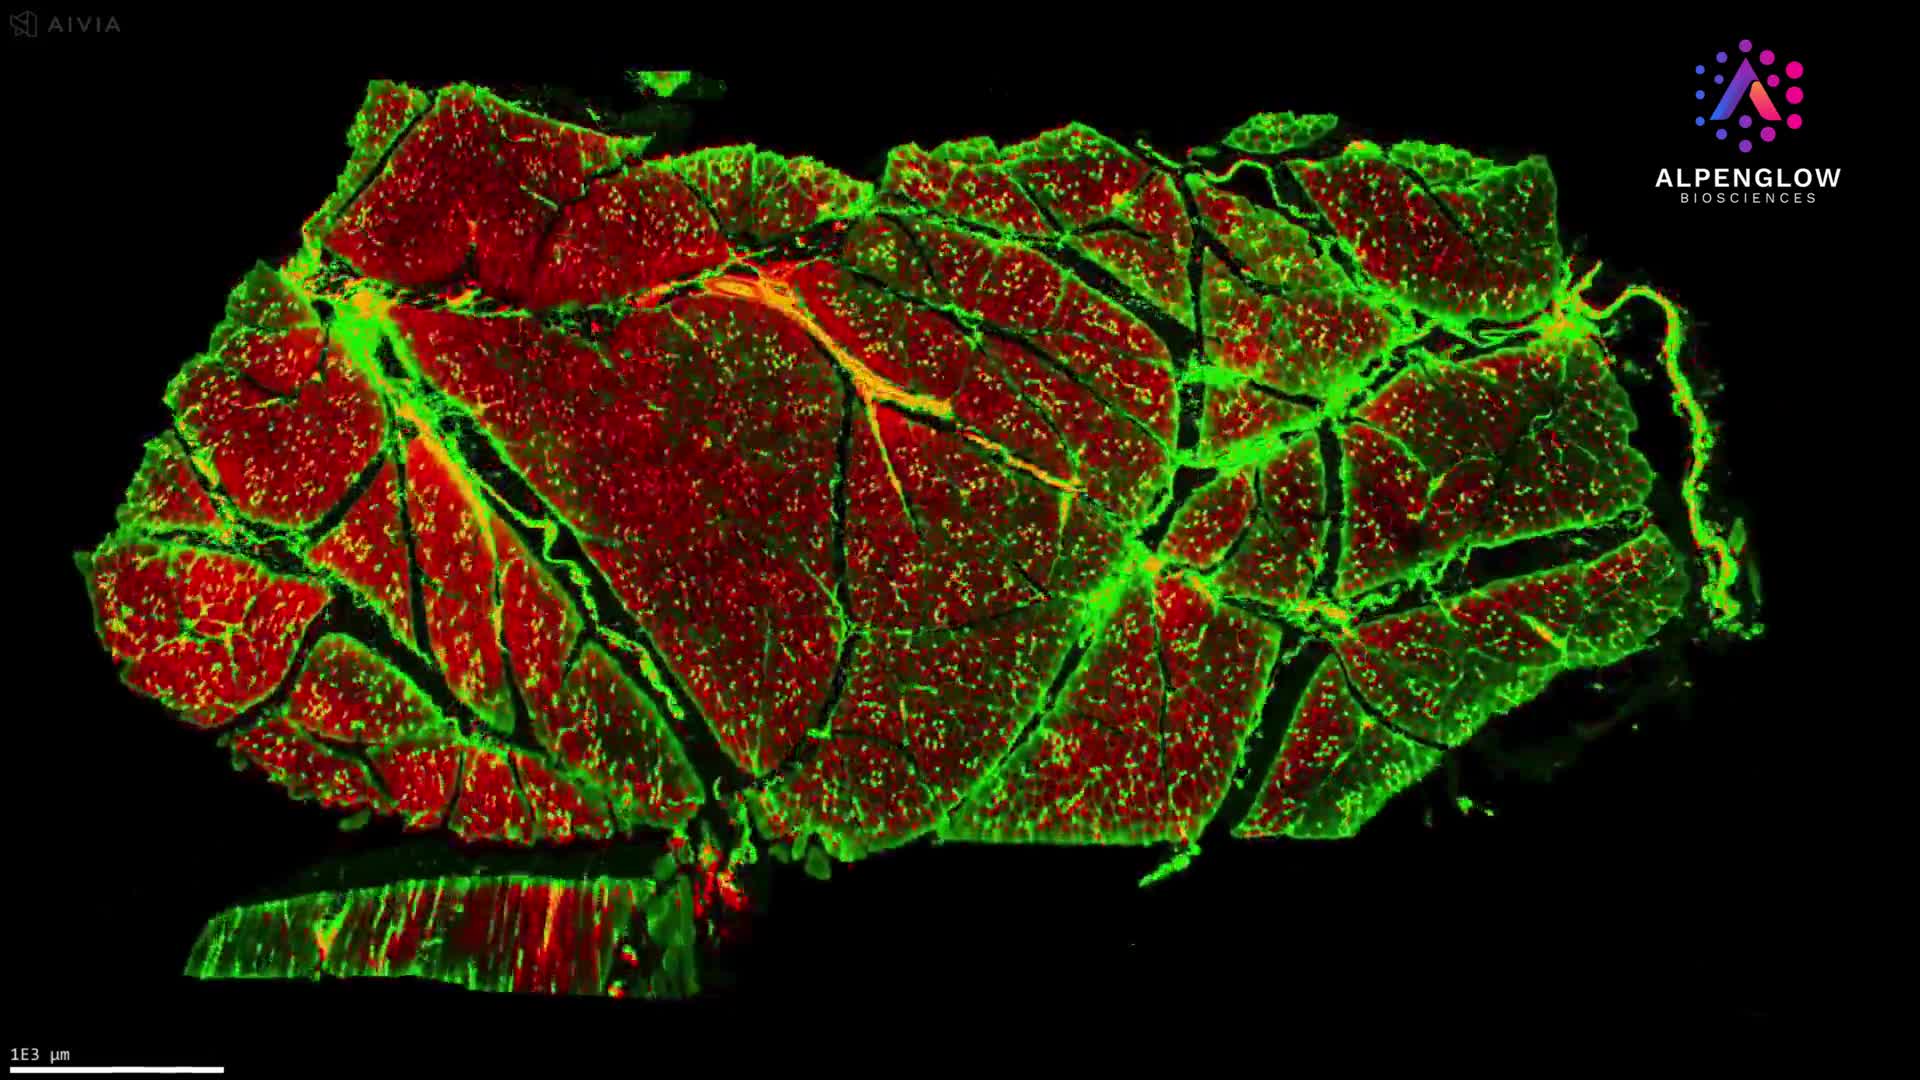
This video presents high-resolution 3D imaging of an intact mouse colorectal tumor, revealing TLS-associated immune organization across the tissue volume.
B220, shown in green, highlights B-cell-rich regions. CD3, shown in magenta, identifies T-cell-rich regions, while nuclei are shown in blue to provide cellular and tissue context. Together, these markers reveal the spatial arrangement of B- and T-cell populations within organized immune aggregates.
The workflow begins with volumetric screening of the cleared tumor to identify regions containing dense B220 and CD3 signal. Selected regions are then imaged at higher resolution, preserving their position within the surrounding tumor while revealing cellular organization in greater detail.
With appropriate segmentation and validated TLS criteria, the dataset can support analysis of aggregate numbers, volume, distribution, cellular organization, and spatial relationships with surrounding tumor regions.
Explore how 3D tissue imaging supports immuno-oncology research across tumor architecture, immune-cell organization, and spatial relationships.
The tissue was imaged using the Aurora 3D™ Spatial Biology Solution, including the 3Di™ Hybrid Open-Top Light-Sheet microscope.