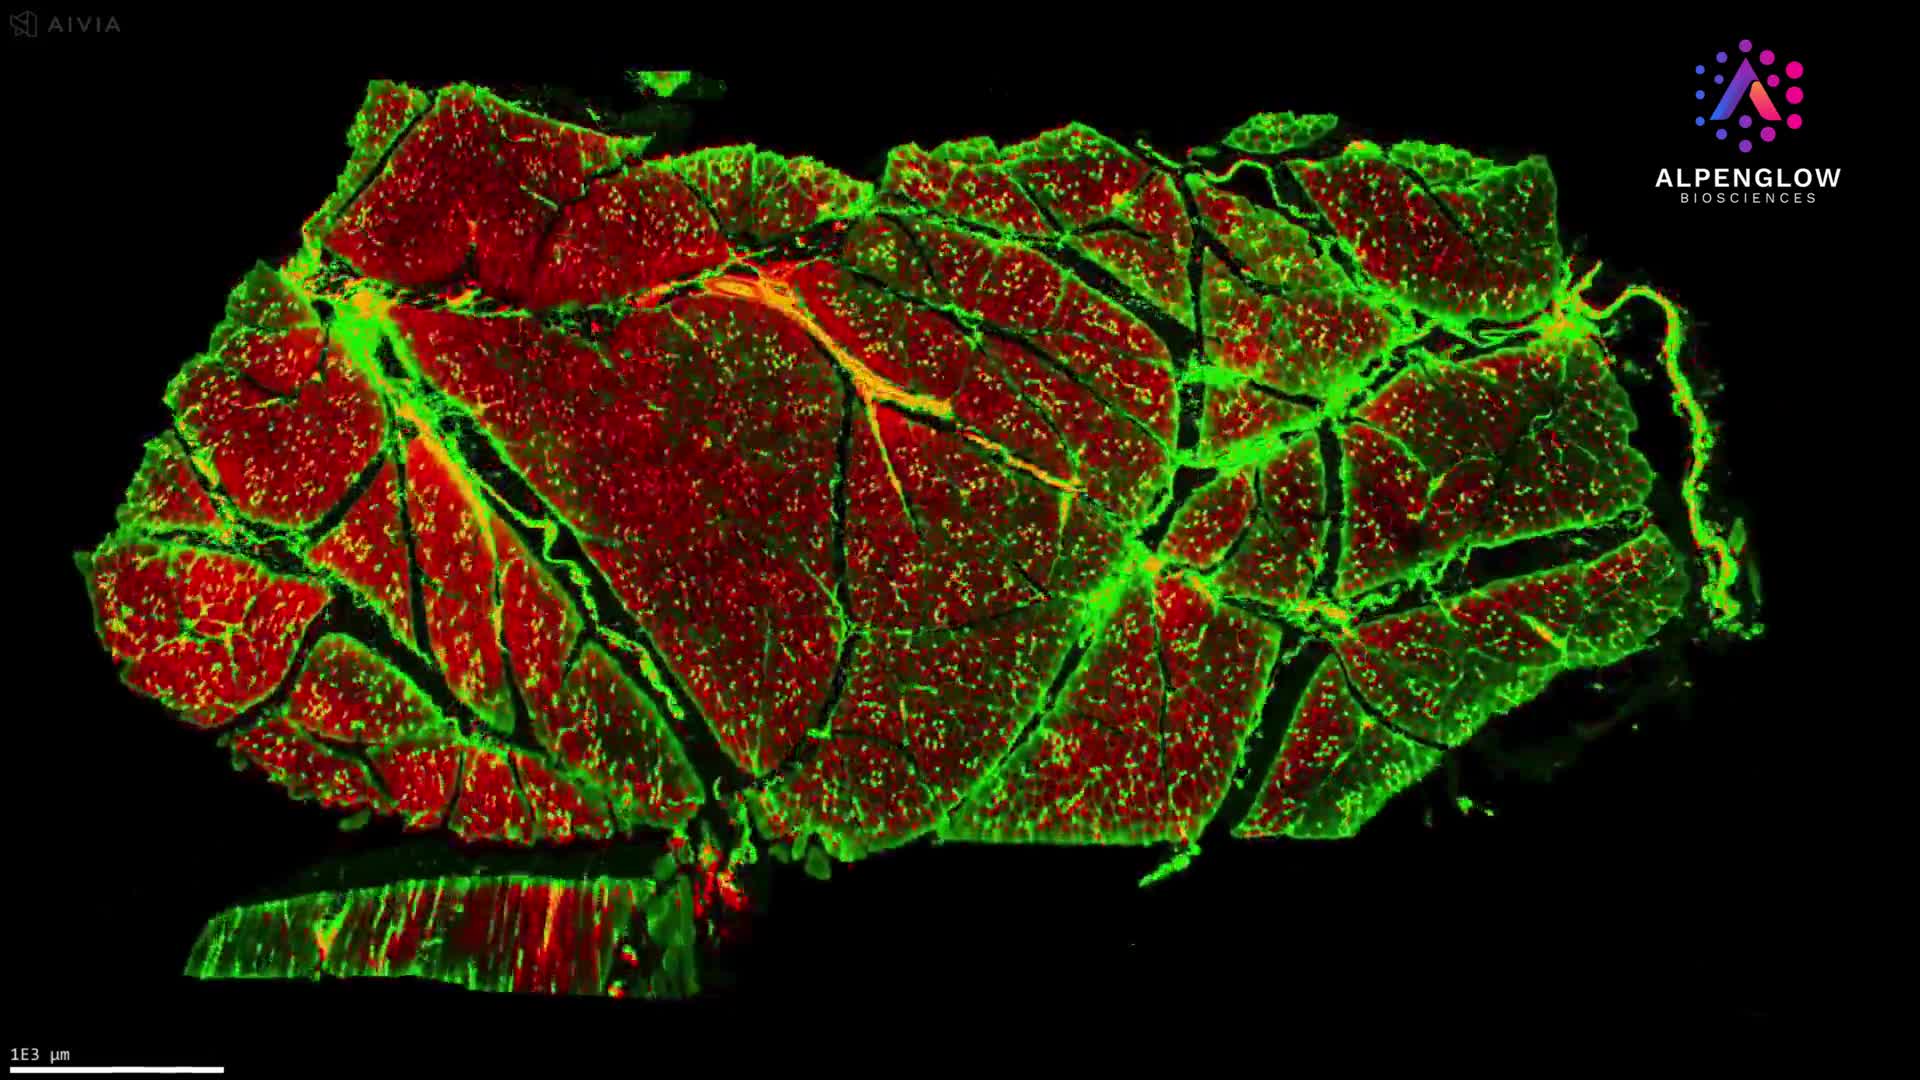
3D Visualization of Cytotoxic T Cells and Macrophages in Human Tonsil
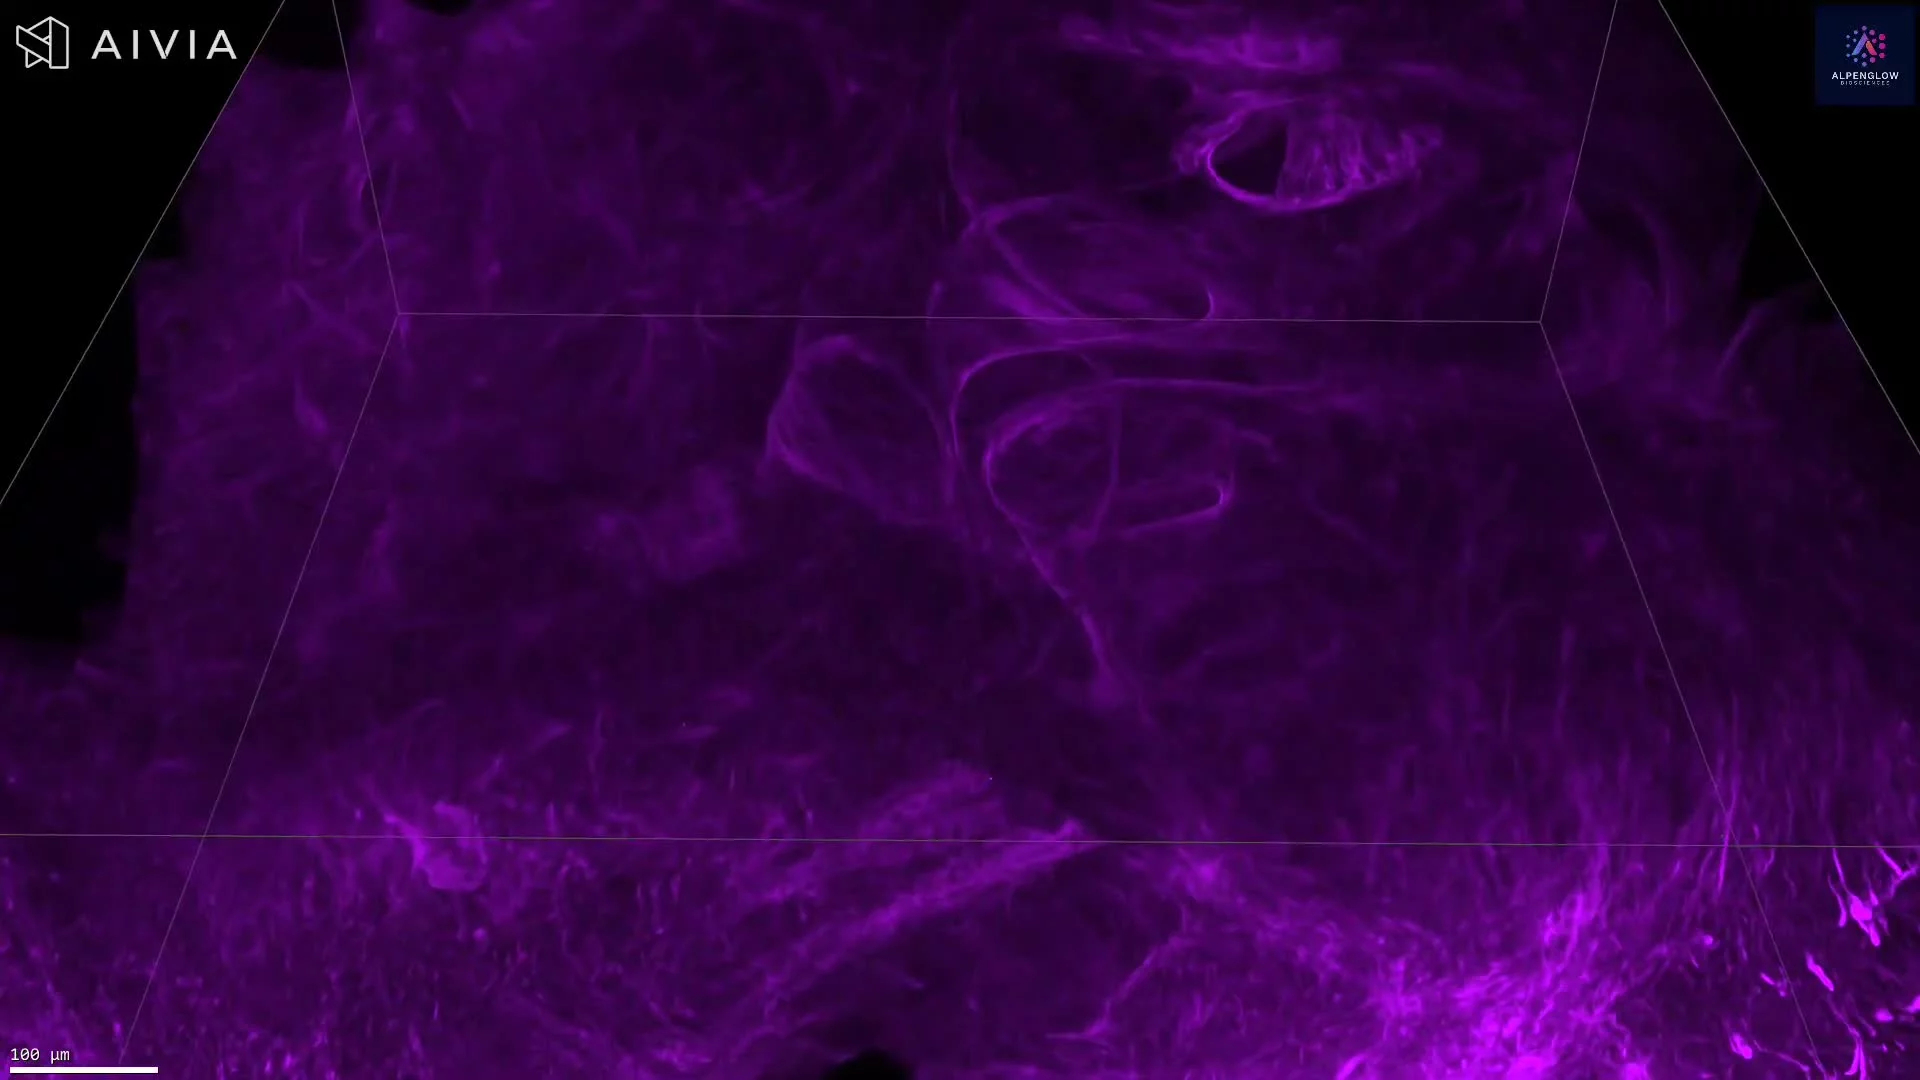
This 3D visualization of human tonsil tissue highlights the spatial distribution and organization of immune cell populations, captured with the Aurora platform using HOTLS microscopy. By retaining tissue integrity, the dataset reveals immune architecture invisible in traditional 2D sections.
Stains used:
TO-PRO-3 (Magenta): Labels cell nuclei
CD8 (Cyan): Marks cytotoxic T cells
CD68 (Yellow): Identifies macrophages
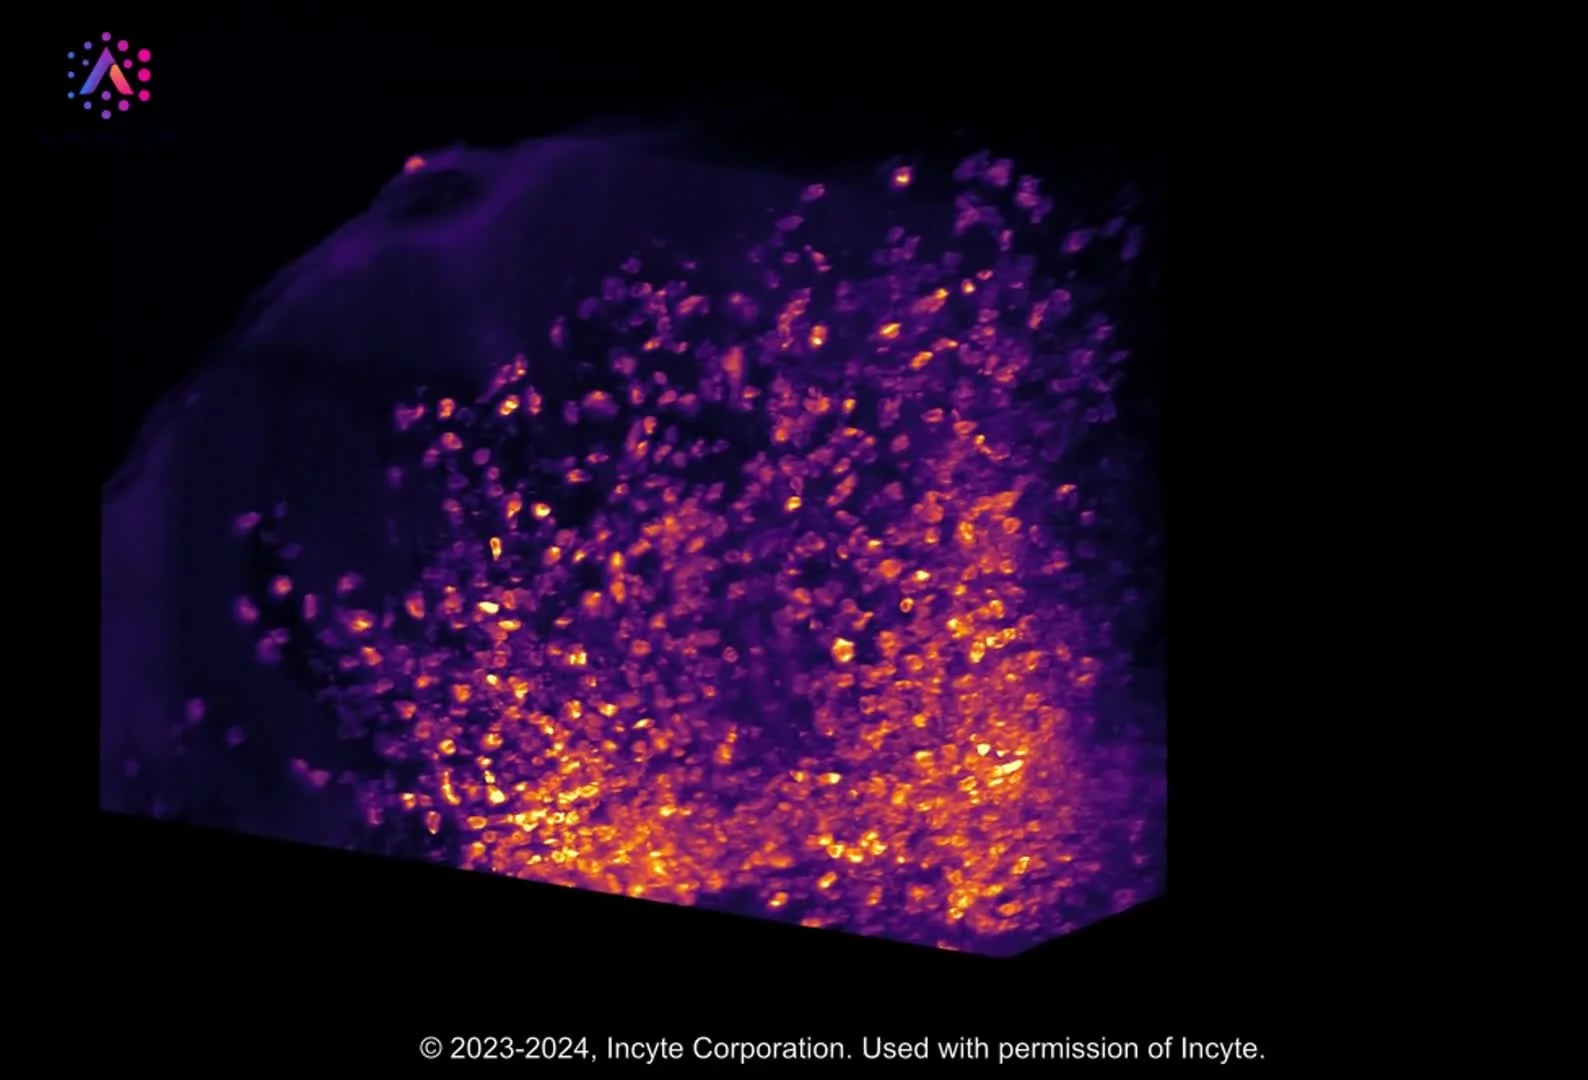
The resulting dataset provides an unprecedented view of immune cell crosstalk within lymphoid tissue. Advanced 3Dm data management and 3Dai AI-powered segmentation workflows enable precise quantification of T cell and macrophage density, distribution, and proximity.
Such spatially resolved data drives discoveries in immunology research and strengthens applications in immuno-oncology, where mapping cytotoxic T cell infiltration and macrophage activity is essential for understanding tumor immunity and therapeutic response.
This work exemplifies how 3D histology, digital pathology, and spatial profiling accelerate translational research by providing actionable, quantitative insights.