

See 3D Tissue Imaging in Action
Spatial Biology & Digital Pathology Applications
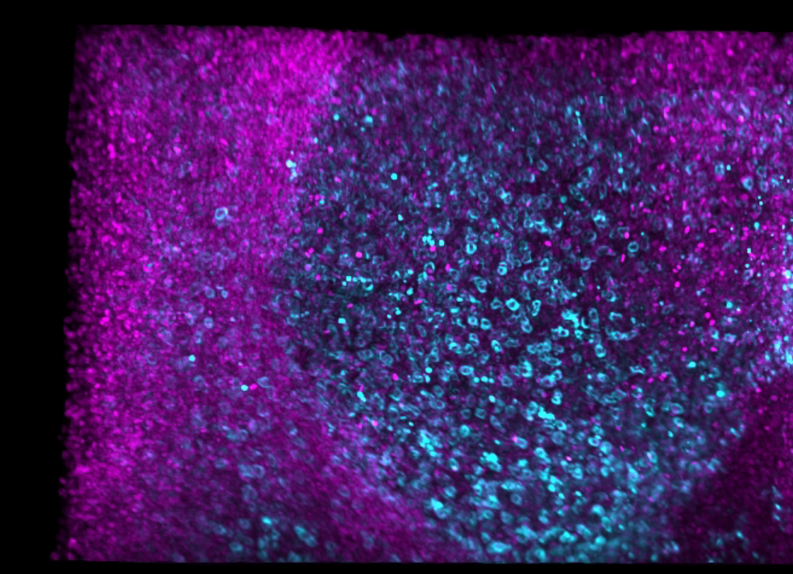
Identification of Memory T-Cells through CD45RO Staining
High resolution image of human tonsil measuring up to 3mm in x,y,z, stained with Biolegend anti-CD45RO. This antibody has been optimized for a variety of human tissue including FFPE samples.
Deep Tissue Staining with anti-CD3 to Identify T-cells
Low resolution image of human tonsil measuring up to 3mm in x,y,z, stained with Biocare Medical BC33 anti-CD3. This antibody has been optimized for a variety of human tissue including FFPE samples.
Identifying cytotoxic T-cells in cleared, thick tissue samples through CD8 Staining
Low resolution image of human tonsil measuring up to 3mm in x,y,z, stained with Biocare Medical SP6 anti-CD8. This antibody has been optimized for a variety of human tissue including FFPE samples.
3D Visualization of Cytotoxic T Cells and Macrophages Using CD8 and CD68 Staining
Explore the intricate distribution of immune cells in human tonsil tissue. This 3D visualization highlights cytotoxic T cells (CD8), macrophages (CD68), and nuclei (TO-PRO-3), offering a detailed view of immune architecture.
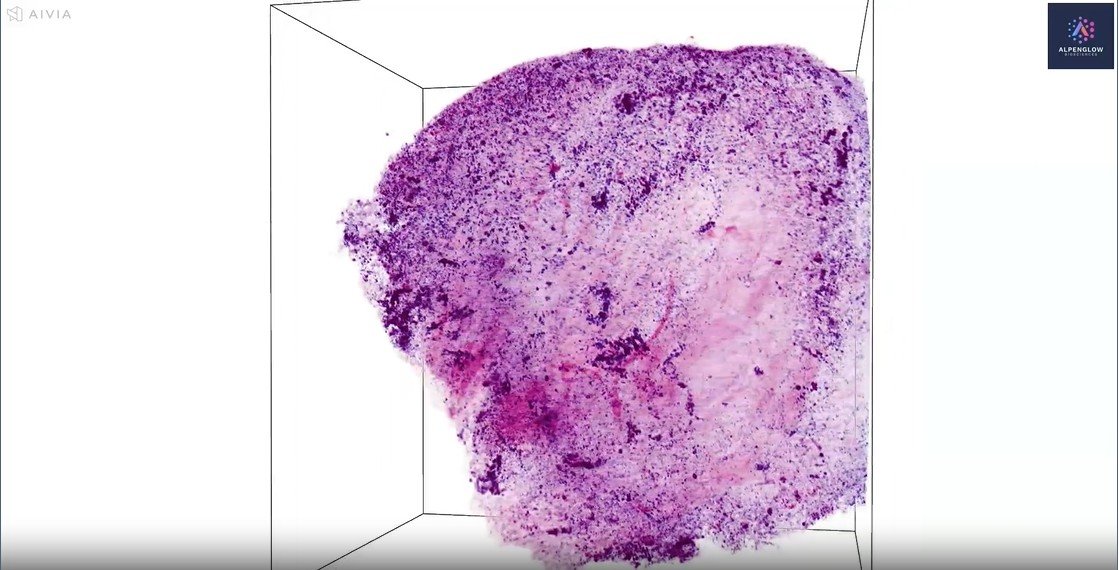
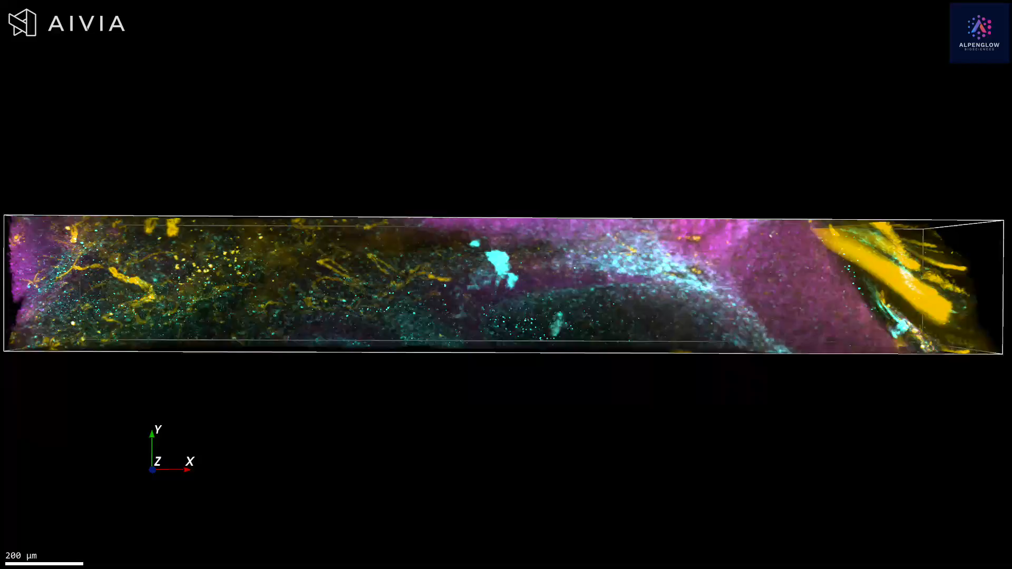
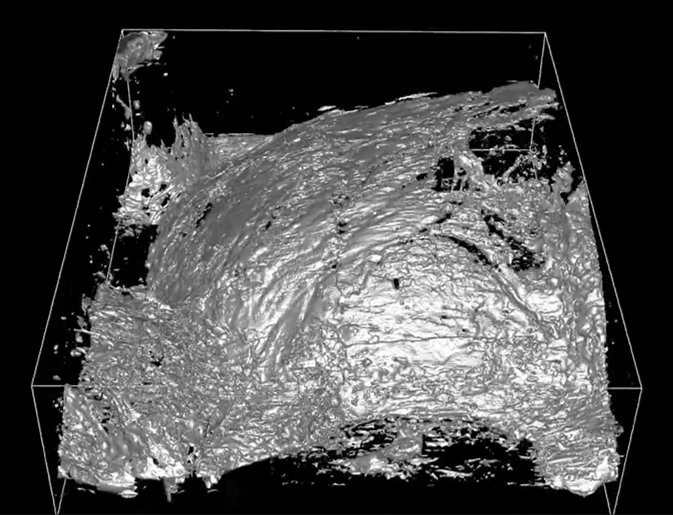
Low-resolution imaging of a human dorsal root ganglion (DRG) sample
This video presents low-resolution (scout) imaging of a human dorsal root ganglion (DRG) sample provided by AnaBios. The sample features computational H&E staining, with ToPro-3 highlighting nuclei and Eosin-capturing protein structures.
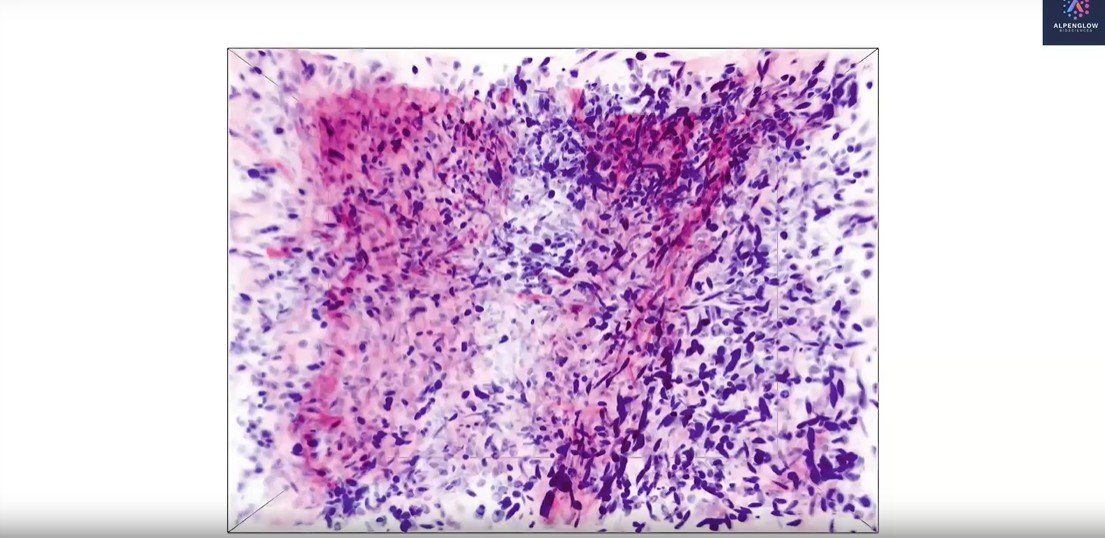
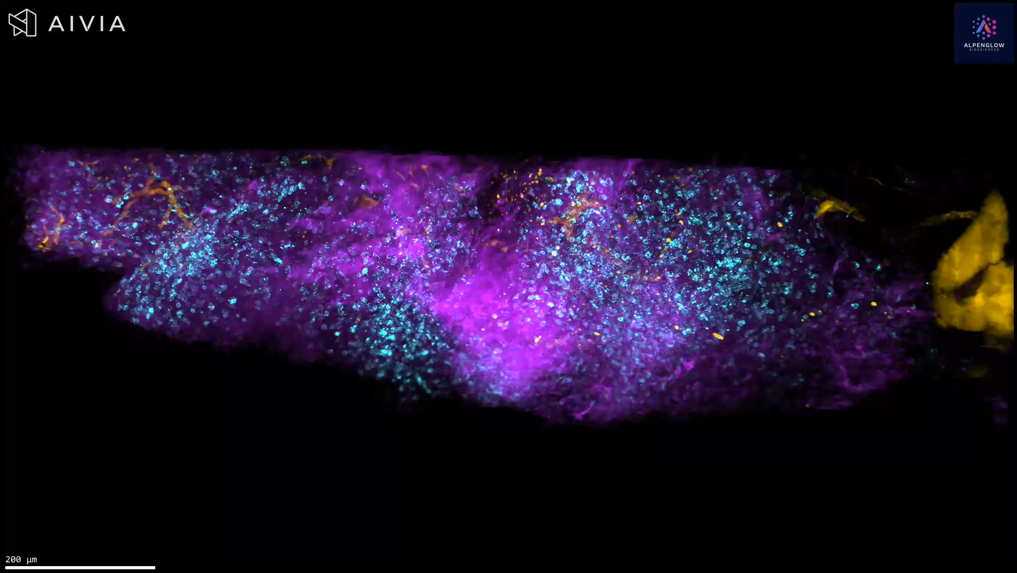
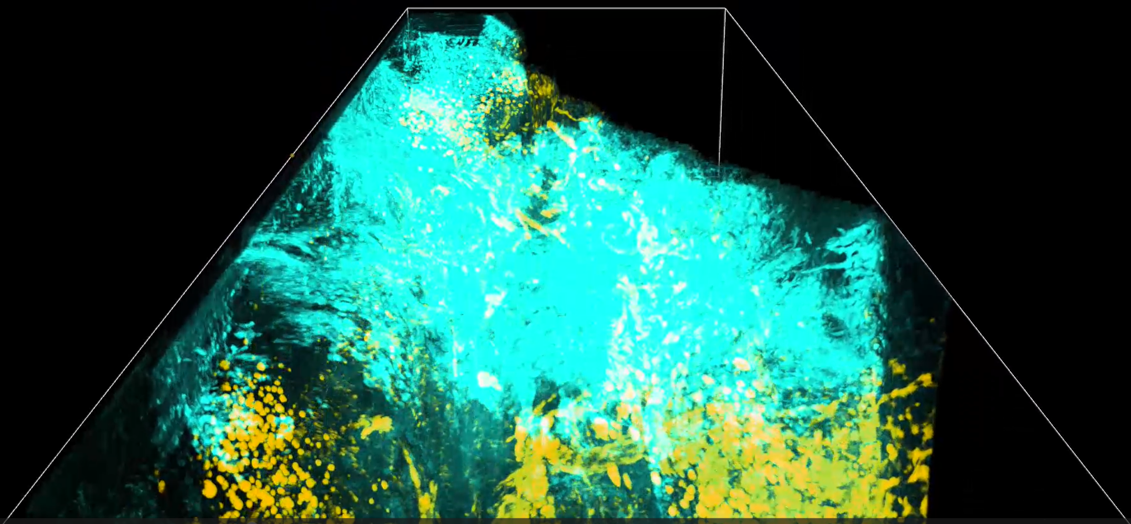
High-Resolution imaging of a Human Dorsal Root Ganglion (DRG) sample
This video presents high-resolution (zoom) imaging of a human dorsal root ganglion (DRG) sample provided by AnaBios. The sample features computational H&E staining, with ToPro-3 highlighting nuclei and Eosin-capturing protein structures. A fascinating visualization offering insights into DRG tissue composition.
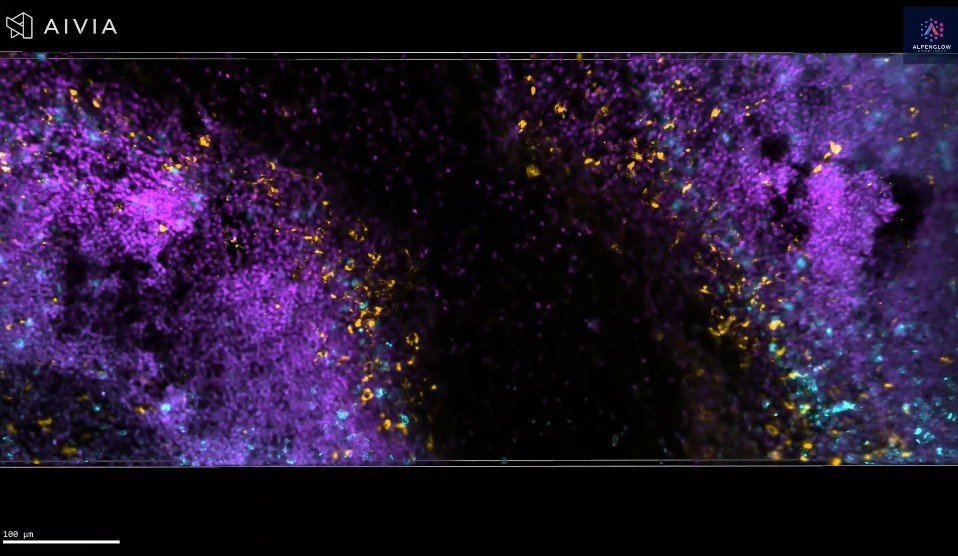
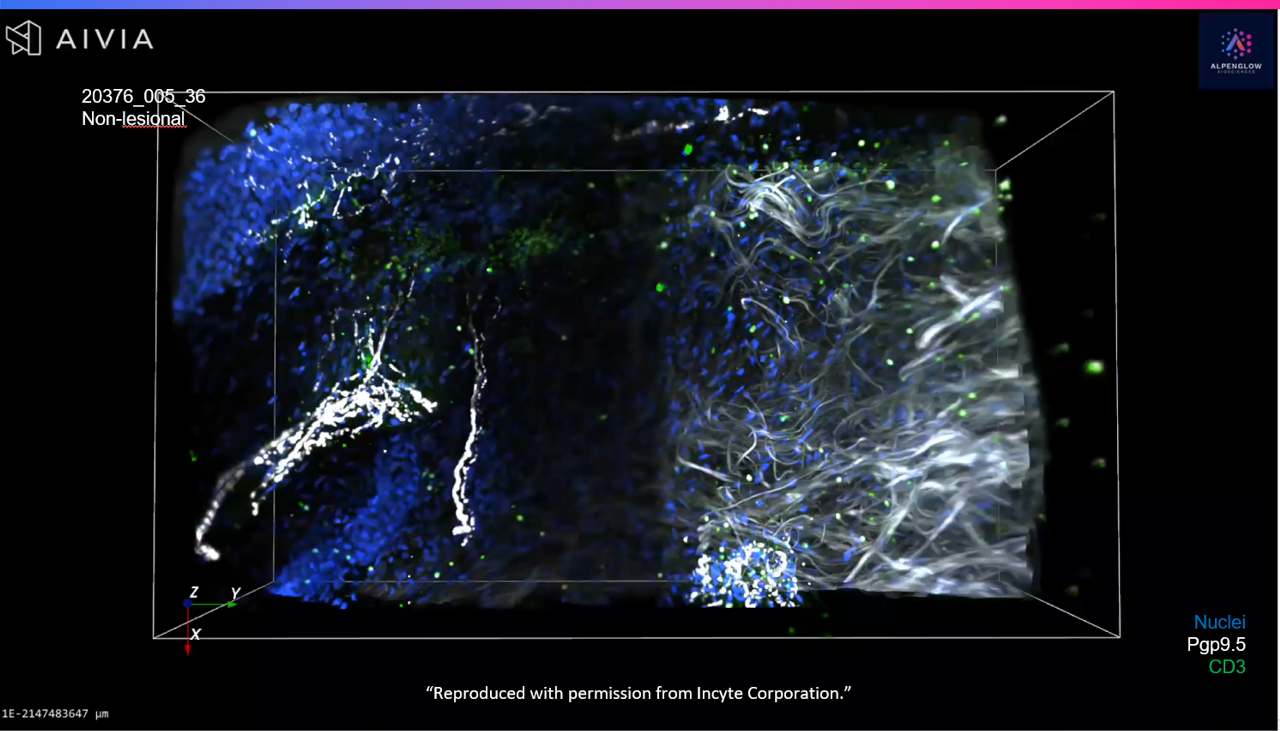
Low-resolution whole-sample 3D imaging of a lesional Atopic Dermatitis punch biopsy
Low resolution image of a lesional Atopic Dermatitis sample stained with PGP9.5 (white) to highlight fine epidermal innervation, TO-PRO-3 (blue) for nuclear detail, and CD3 (green) to illuminate T-Cell infiltration of the Epidermis and Dermis. Image reproduced with permission from Incyte Corporation. The tissue measured approximately 2.5mm X 2.5mm X 2.5mm.
High-resolution (40X) 3D imaging of a Region of Interest in a lesional Atopic Dermatitis sample
40X image of a lesional Atopic Dermatitis samples stained with PGP9.5 (white) to highlight fine epidermal innervation, TO-PRO-3 (blue) for nuclear detail, and CD3 (green) to illuminate T-Cell infiltration of the Epidermis and Dermis. Image reproduced with permission from Incyte Corporation.
Collagen III staining and 3D imaging followed by image analysis and segmentation highlighting liver fibrosis
Incredible 3D spatial biology image of a liver biopsy with collagen III staining (yellow) followed by image analysis using a pixel classification scheme
Segmentation analysis of liver fibrosis and steatosis
Amazing 3D video of liver biopsy sample highlighting variability of steatosis.

Fly through image of H&E stained Liver biopsy
Fly through of H&E stained liver biopsy.

Spatial Segmentation and Analysis of TLSs in Non-Small Cell Lung Cancer Tissue with the Alpenglow Biosciences 3Di Spatial Imaging Platform

Large volumetric 3D imaging of human colon
Large volumetric image of human colon. Welcome to the enteric nervous system!

Amazing 3D Image of an Ileocecal Sample
This human ileocecal sample contains more pixels than stars in the Milky Way galaxy! There are more than 840 billion pixels in the 3D scan of this sample encompassing a total volume of 2,350 cubic millimeters.

Journal club review: Multiplex 3D Atlas
A tour de force paper by Lin et al from the Sorger Lab at Harvard. This paper is chock full of 3D tumor architecture, tertiary lymphoid structures and spatial heterogeneity in human colorectal cancer samples. Read our key findings from the paper below.

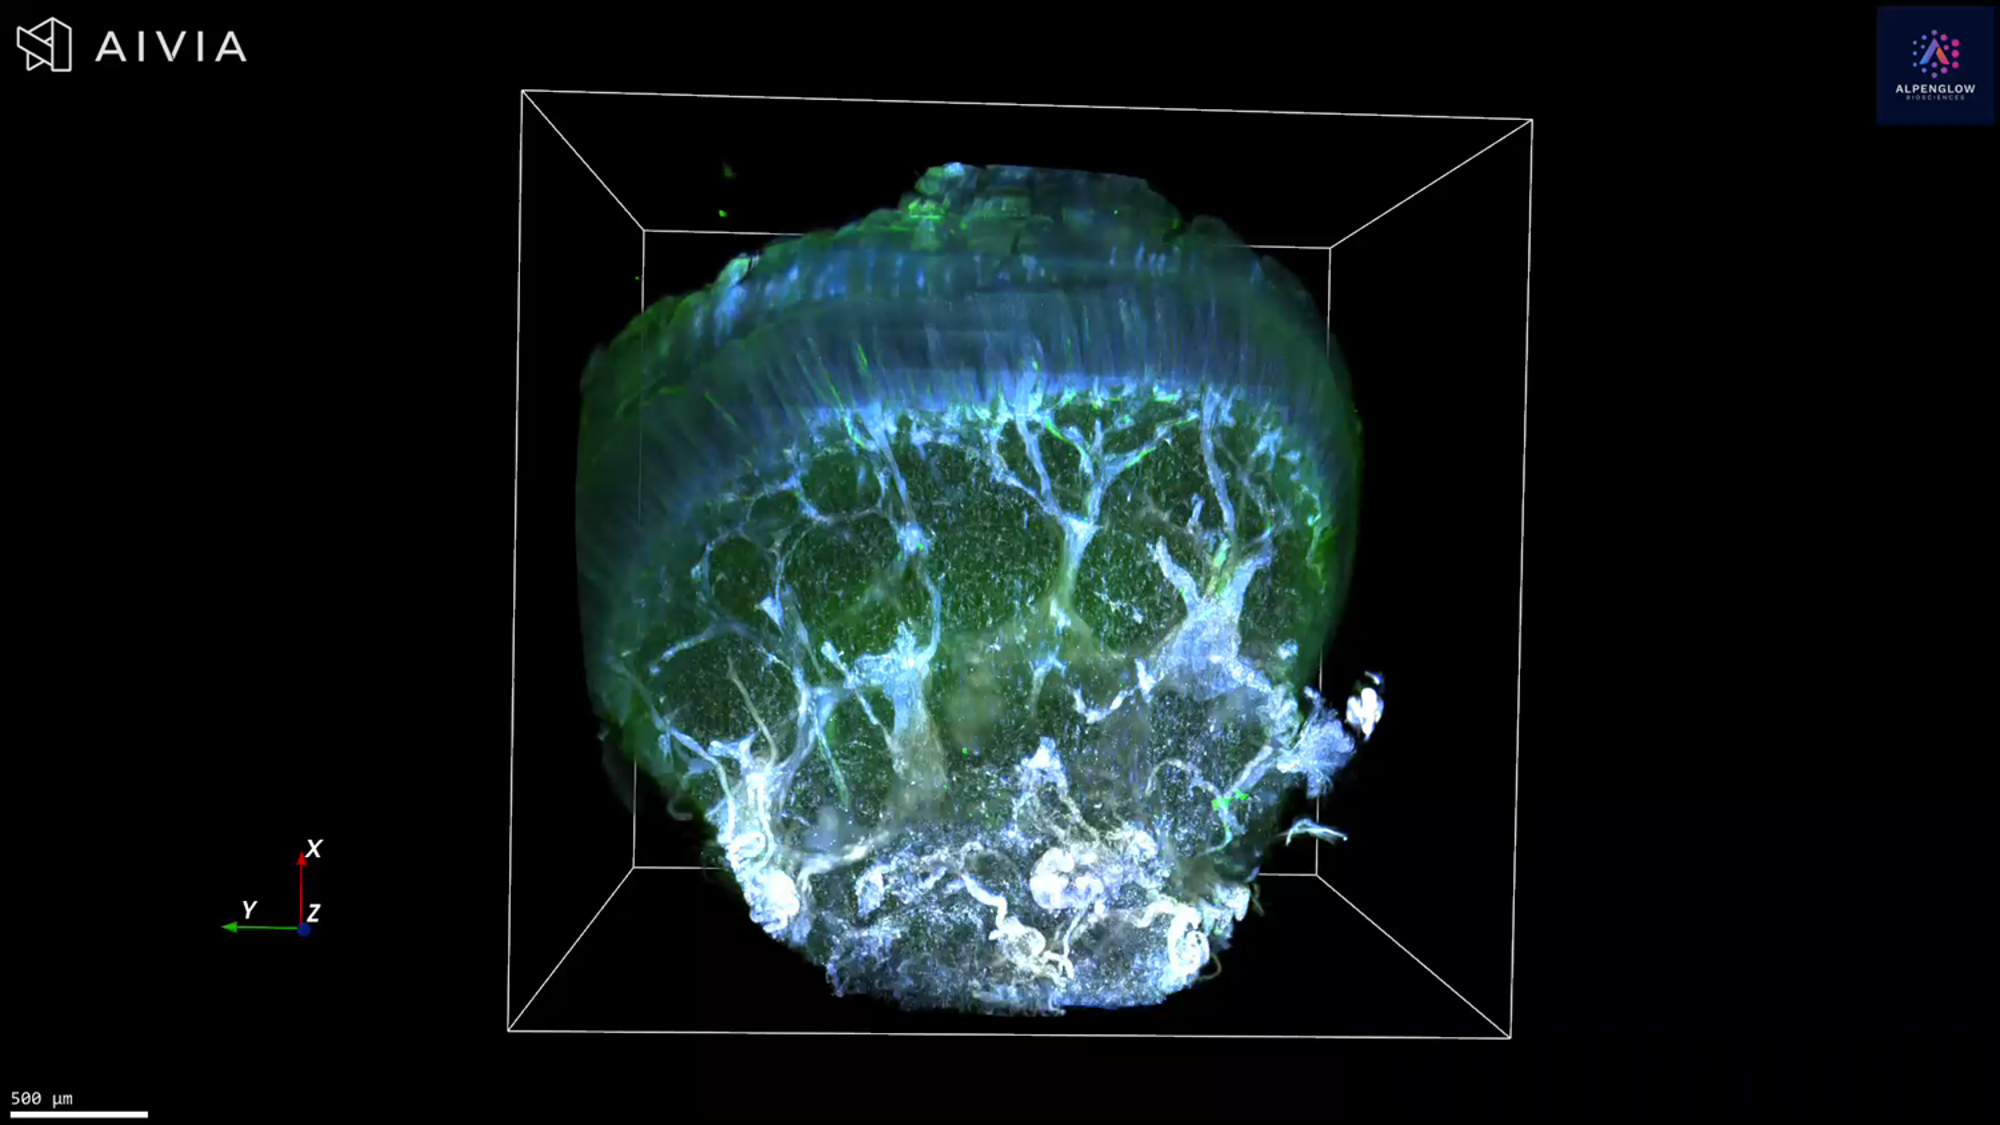
Whole Human Brain Slice
Human brain slice optically cleared using CUBIC protocol. Brain tissue autofluorescence is shown in black and white with amyloid small molecule stain (pFTAA) is shown in green.

Cleared Mouse Tissue
Mouse fat pad with labeled blood vessels using lectin (red), macrophages immuno-fluorescently labelled with CD68 (turquoise), and nerves labelled with PGP9.5 (green)
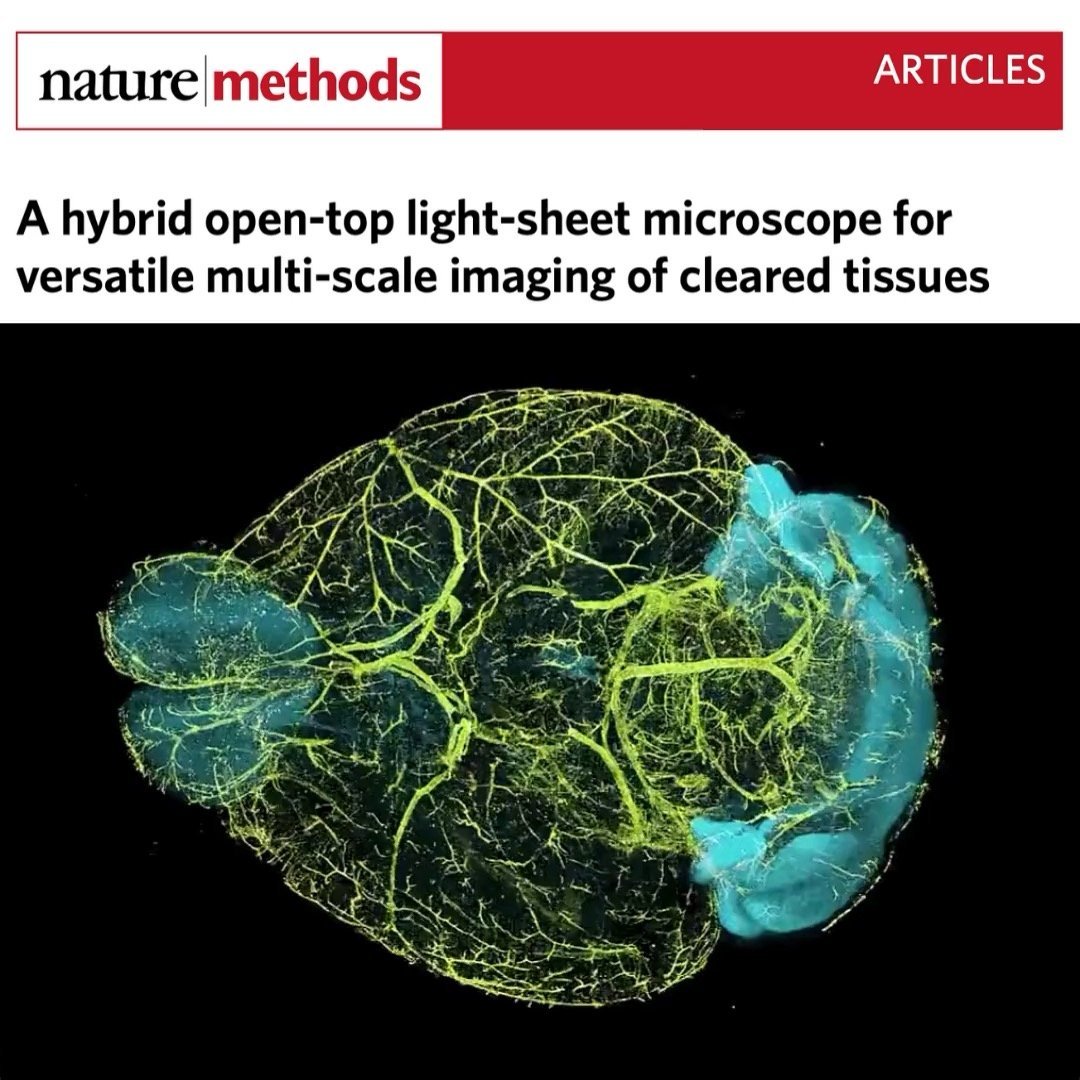
Alpenglow Co-Founders on Nature Methods
